Ingesting Event Data from Splunk Forwarder/SC4S to Kafka
The goal of this post is to quickly test/analyze methods to send event data from Splunk Forwarders or SC4S to Apache Kafka deployments. There may be several reasons for this, such as performing stream analytics, event filtering/aggregation prior to indexing data into Splunk, populating multiple analytics platforms with the same data, developing custom applications on streaming data, etc. When utilizing Kafka as a streaming platform within the data ingest pipeline, organizations usually rely on open-source tools and/or open-data formats (e.g. JSON). However, the issue somewhat becomes a problem when there are thousands of Splunk Forwarders (or many SC4S instances) already deployed in an environment and it is not a simple task to switch to different tools where it’s been already pretty convenient to manage them with Deployment Server.

TL;DR
I tried to summarize 4 different methods for this task with pros/cons based on my view/understanding. I may be missing some of the finer details with this limited test, so I’d appreciate any comments/suggestions.
- Confluent — Splunk S2S Source Connector
Pros:
- Commercial support.
- JSON formatted metadata in Kafka and event data as a string. Cons:
- Licensed connector.
- Confluent — Splunk HTTP Source Connector
Pros:
- Commercial support.
- JSON formatted metadata in Kafka and event data as a string. Cons:
- Licensed connector.
- Cribl
Pros:
- Commercial support (with license purchase).
- Free up to 1TB/day ingest. Cons:
- May bring operational overhead just for limited use-cases; Cribl has Manager, Worker, etc. to become a distributed platform with many features available.
- Licensed product.
- Vector
Pros:
- Open source with MPL2.0 licensing.
- Both metadata and event data (if JSON) are properly written in JSON to the Kafka topic.
- Simple configuration. Cons:
- Does not support Splunk S2S (yet?).
- Even though I find this to be a “pro” some people may consider not having a management interface (web app, UI, etc.) to be a disadvantage.
Please note that the tests performed here are simple and covers default functionality, excluding any performance and load considerations, which are pretty significant when dealing with data ingest pipelines ;). Having said that, all of these tools/vendors have significant customers with TBs/day ingest rates.
Out of these options, only Confluent S2S Source Connector and Cribl support Splunk TCP inputs from Universal Forwarders. For sending data from Splunk UF to Kafka, Cribl seems to be a better option due to its simpler configuration and processing pipeline features.
HEC is supported by all of the above. For sending data from SC4S to Kafka, my preference would be Vector due to its licensing (MPL2.0), performance, and easy configuration.
1. Confluent — Splunk S2S Source Connector
The first test is with officially supported and licensed solutions between Splunk and Confluent Kafka while using the default Splunk (Universal) Forwarder configuration as shown below without SSL or compression.
$> cat inputs.conf
[monitor:///tmp/test.log]
index=main
sourcetype=mytest:log
$> cat outputs.conf
[tcpout]
defaultGroup=splunk_s2s_connector
[tcpout:splunk_s2s_connector]
server=localhost:19997
useACK=false
useSSL=false
sendCookedData=true
I also had to match the Splunk S2S Source Connector configuration to support uncompressed and clear-text transmission.
{
  "name": "SplunkS2SSourceConnectorTest",
  "config": {
    "name": "SplunkS2SSourceConnectorTest",
    "connector.class": "io.confluent.connect.splunk.s2s.SplunkS2SSourceConnector",
    "splunk.s2s.port": "19997",
    "kafka.topic": "splunk_s2s_test",
    "splunk.s2s.ssl.enable": "false",
    "splunk.s2s.ssl.client.auth.enable": "false",
    "splunk.s2s.compression.enable": "false"
  }
}
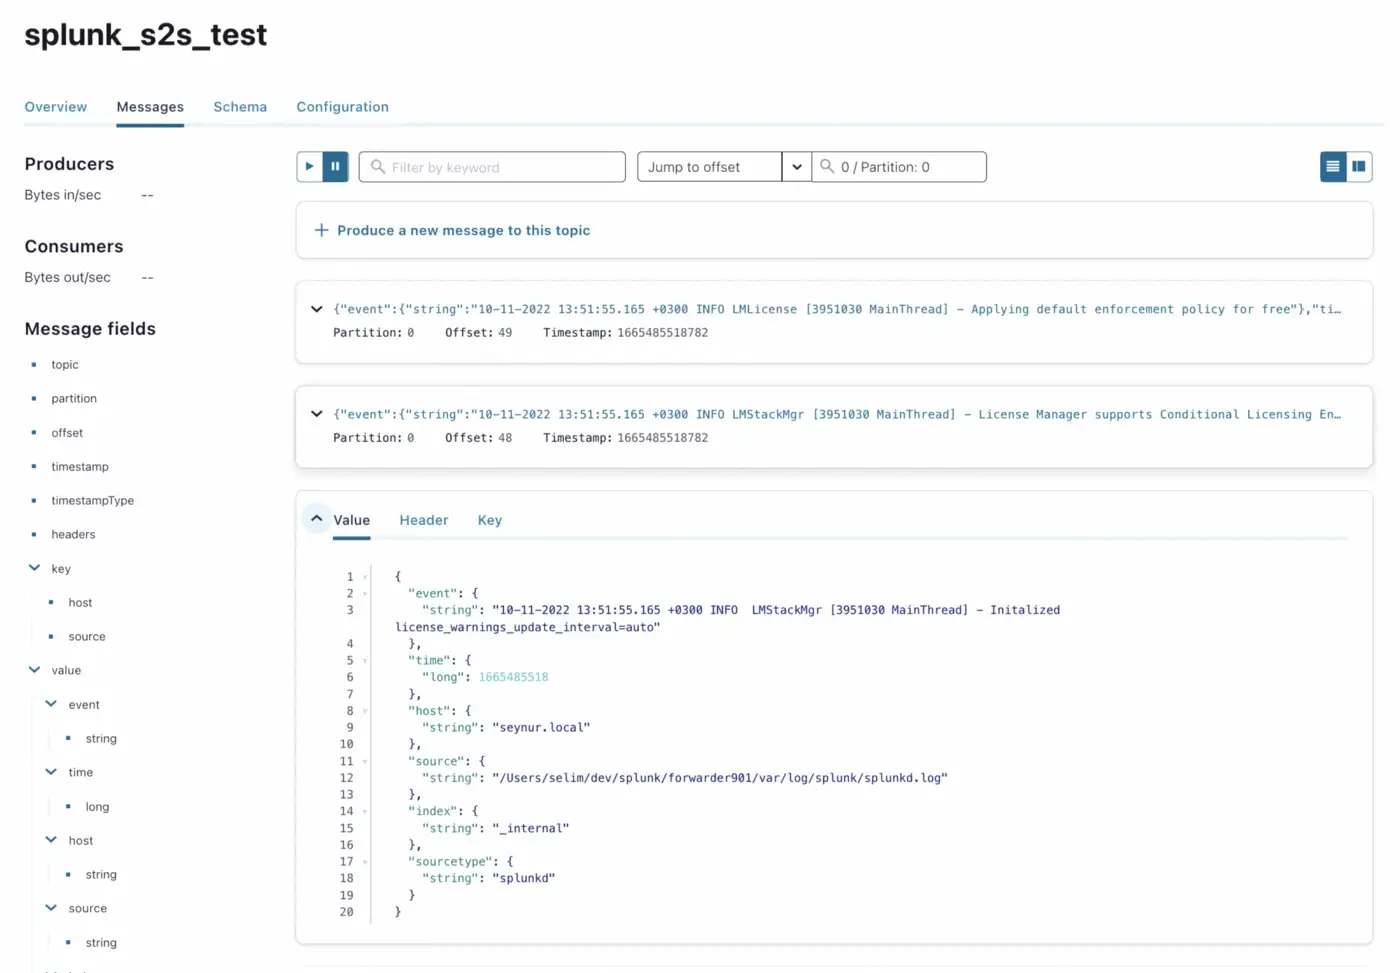
As soon as Splunk Universal Forwarder is started, I was able to see all the internal messages being generated into the topic:
In a few minutes, the connector was in a failed state and when I checked the logs, I noticed the following error (RecordTooLargeException):
$> var/confluent.current/connect/logs/connect.log
...
[2022-10-11 13:52:09,998] ERROR [SplunkS2SSourceConnectorTest|task-0] WorkerSourceTask{id=SplunkS2SSourceConnectorTest-0} Task threw an uncaught and unrecoverable exception. Task is being killed and will not recover until manually restarted (org.apache.kafka.connect.runtime.WorkerTask:207)
org.apache.kafka.connect.errors.ConnectException: Unrecoverable exception from producer send callback
...
        at java.base/java.lang.Thread.run(Thread.java:834)
Caused by: org.apache.kafka.common.errors.RecordTooLargeException: The message is 1241389 bytes when serialized which is larger than 1048576, which is the value of the max.request.size configuration.
Fixed this problem by adding the required setting, default is 1MB and since I disabled compression, it was pretty easy to hit this size limit hence I made it 2MB:
{
  "name": "SplunkS2SSourceConnectorTest",
  "config": {
    "max.request.size": "2097152",
    "name": "SplunkS2SSourceConnectorTest",
    "connector.class": "io.confluent.connect.splunk.s2s.SplunkS2SSourceConnector",
    "splunk.s2s.port": "19997",
    "kafka.topic": "splunk_s2s_test",
    "splunk.s2s.ssl.enable": "false",
    "splunk.s2s.ssl.client.auth.enable": "false",
    "splunk.s2s.compression.enable": "false"
  }
}
Once this configuration is in place, it worked as expected. Next step is to test with the custom test.log input.
$> echo "`date -Iseconds` fielda=valuea fieldb=1234" >> /tmp/test.log
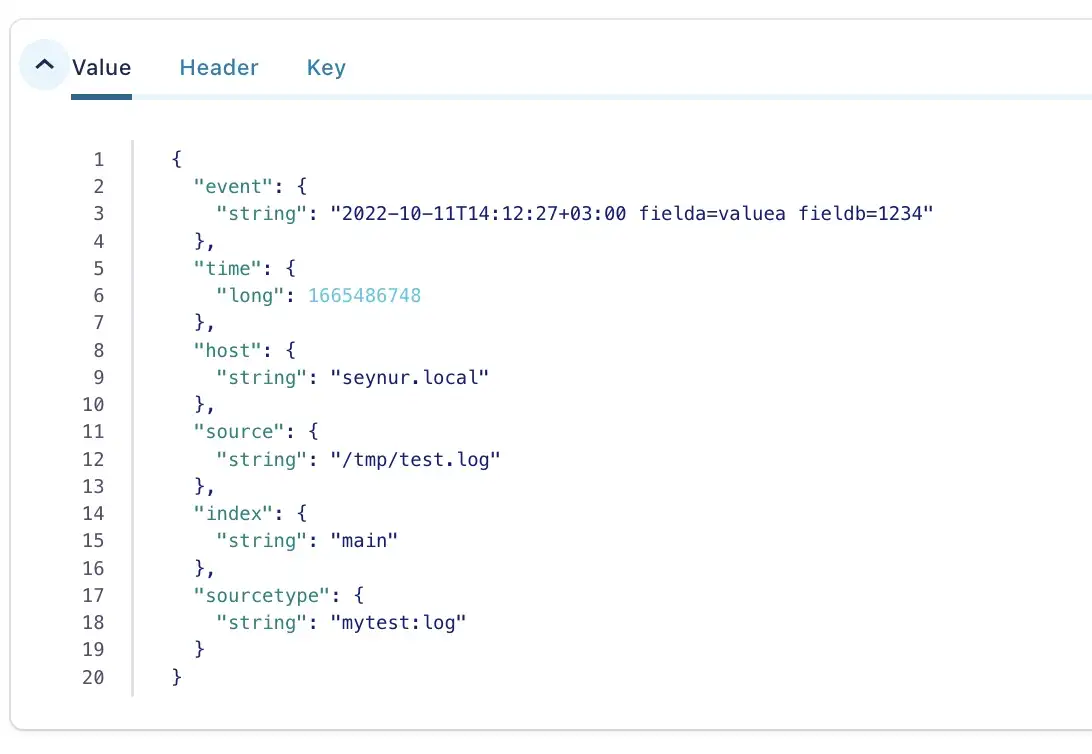
I verified the event in the topic via the console consumer and Confluent Control Center.
$> kafka-console-consumer --bootstrap-server localhost:9092 --topic splunk_s2s_test
2022-10-11T14:12:27+03:00 fielda=valuea fieldb=1234
2. Confluent — Splunk HTTP Source Connector
HEC input may be necessary especially for sending data from SC4S for an already existing pipeline. This may be the case where you already have SC4S setup in many locations and are happy with its configuration or too lazy to switch to anything else. If you’d like to utilize syslog-ng with Kafka, you can review my previous blog post.
For this test, I used the following Splunk HTTP Source Connector configuration.
{
  "name": "SplunkHttpSourceConnectorConnector_0",
  "config": {
    "name": "SplunkHttpSourceConnectorConnector_0",
    "connector.class": "io.confluent.connect.SplunkHttpSourceConnector",
    "splunk.port": "18088",
    "splunk.ssl.renegotiation.allowed": "false",
    "splunk.ssl.key.store.path": "/Users/selim/tmp/keystore/testserver.jks",
    "splunk.ssl.key.store.password": "***********",
    "splunk.collector.authentication.tokens": "************************************",
    "kafka.topic": "splunk_hec_test"
  }
}
Note that I had to create a Keystore for the SSL server. You can find instructions at keytool documentation. I actually used the following command to generate the simple Keystore.
keytool -genkey -alias testserver -keyalg RSA -keypass password123 -storepass password123 -keystore testserver.jks -keysize 2048 -validity
To test HEC setup, I used the example from Splunk documentation.
$> curl -k "https://127.0.0.1:18088/services/collector/event" \
-H "Authorization: Splunk eb514d08-d2bd-4e50-a10b-f71ed9922ea0" \
-d '{"sourcetype": "_json", "event": {"a": "value1", "b": ["value1_1", "value1_2"]}}'
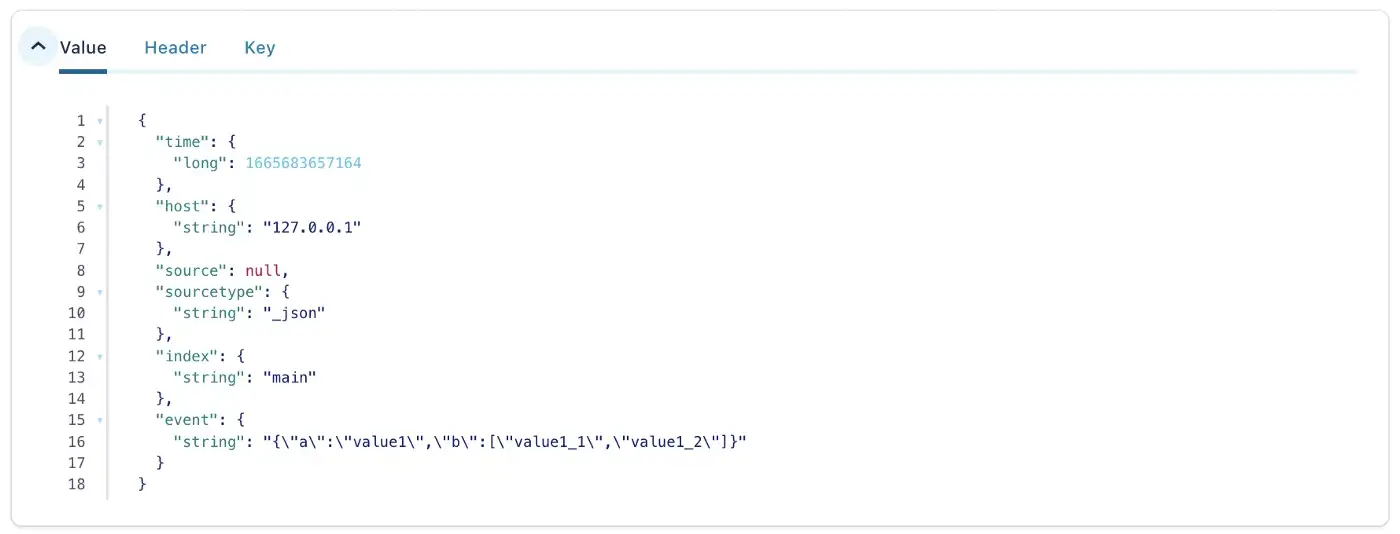
The topic is populated as following:
3. Cribl
Cribl binaries are compiled for specific platforms and so far it’s available for x64 and ARM64 only. Since I’m running my tests locally on Apple silicon I wanted to try the docker image. I used the docker configuration for Cribl and added port mapping for Splunk forwarder. Unfortunately, I ran into issues with the docker image for some reason. There were some connectivity errors (both from the Splunk source and Kafka destination test) despite configuring port forwarding settings as documented. The error messages were not clear enough for me to dig deeper. Following this bit of frustration, I set up Cribl on a separate Linux box.
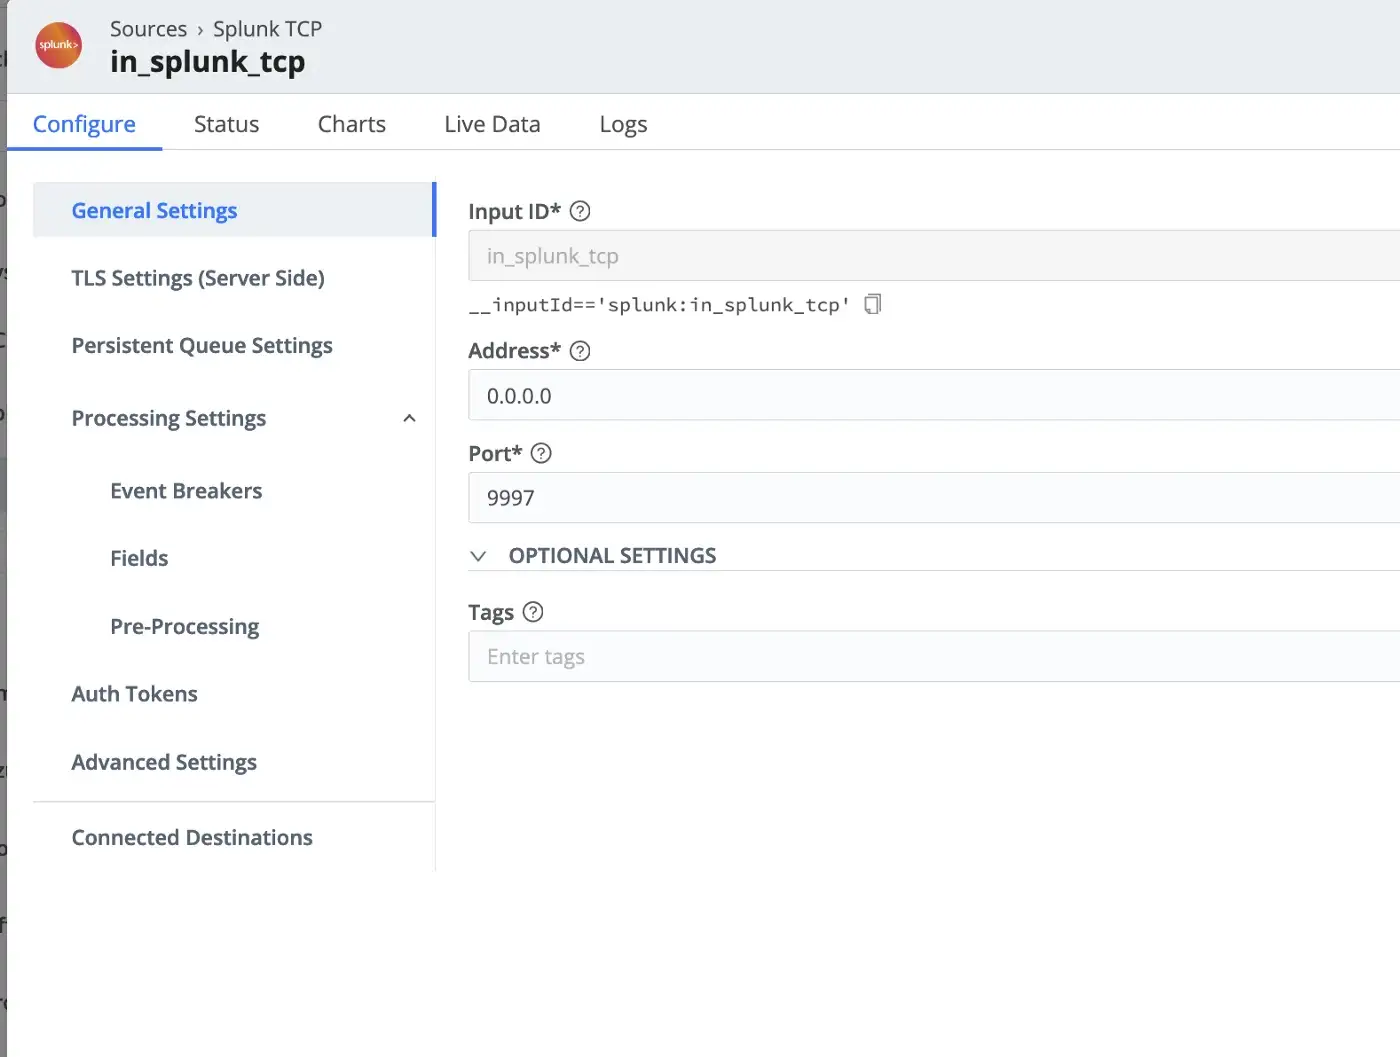
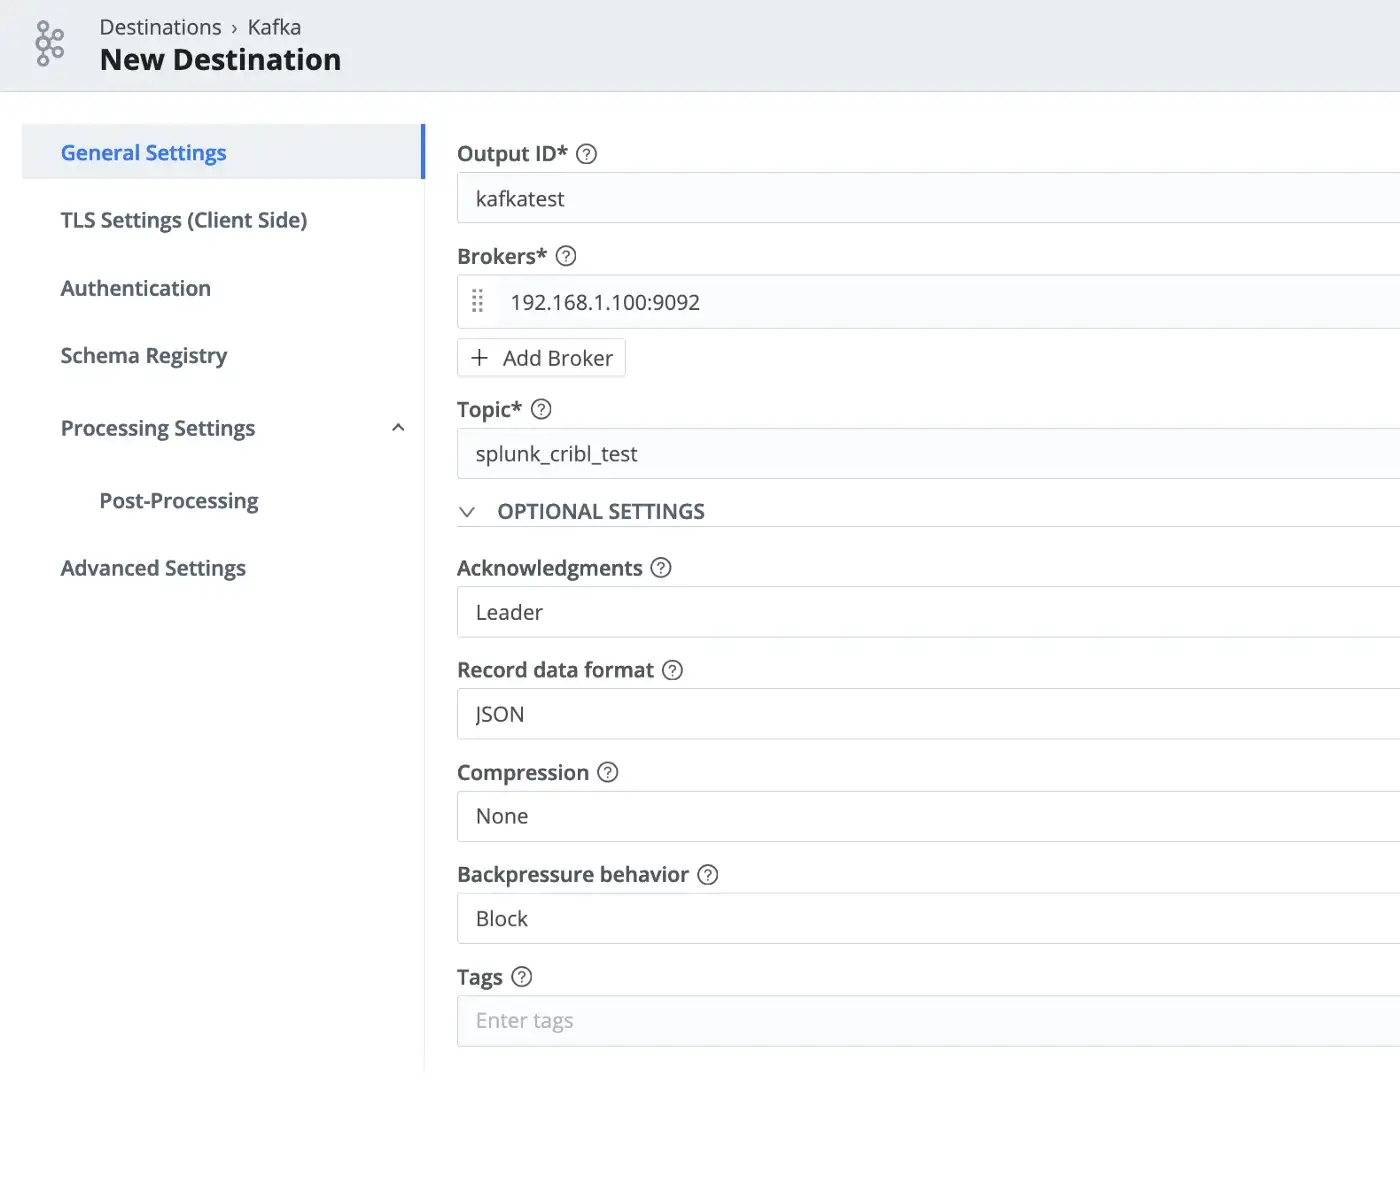
Setting up a source and a destination turned out to be quite easy in Cribl. In this test, I used both Splunk TCP source and Kafka destination options with the given default values as follows.
Splunk forwarder configuration points to Cribl as the destination instead of the indexer.
$> cat outputs.conf
[tcpout]
defaultGroup=splunk_cribl
[tcpout:splunk_cribl]
server=criblserver:9997
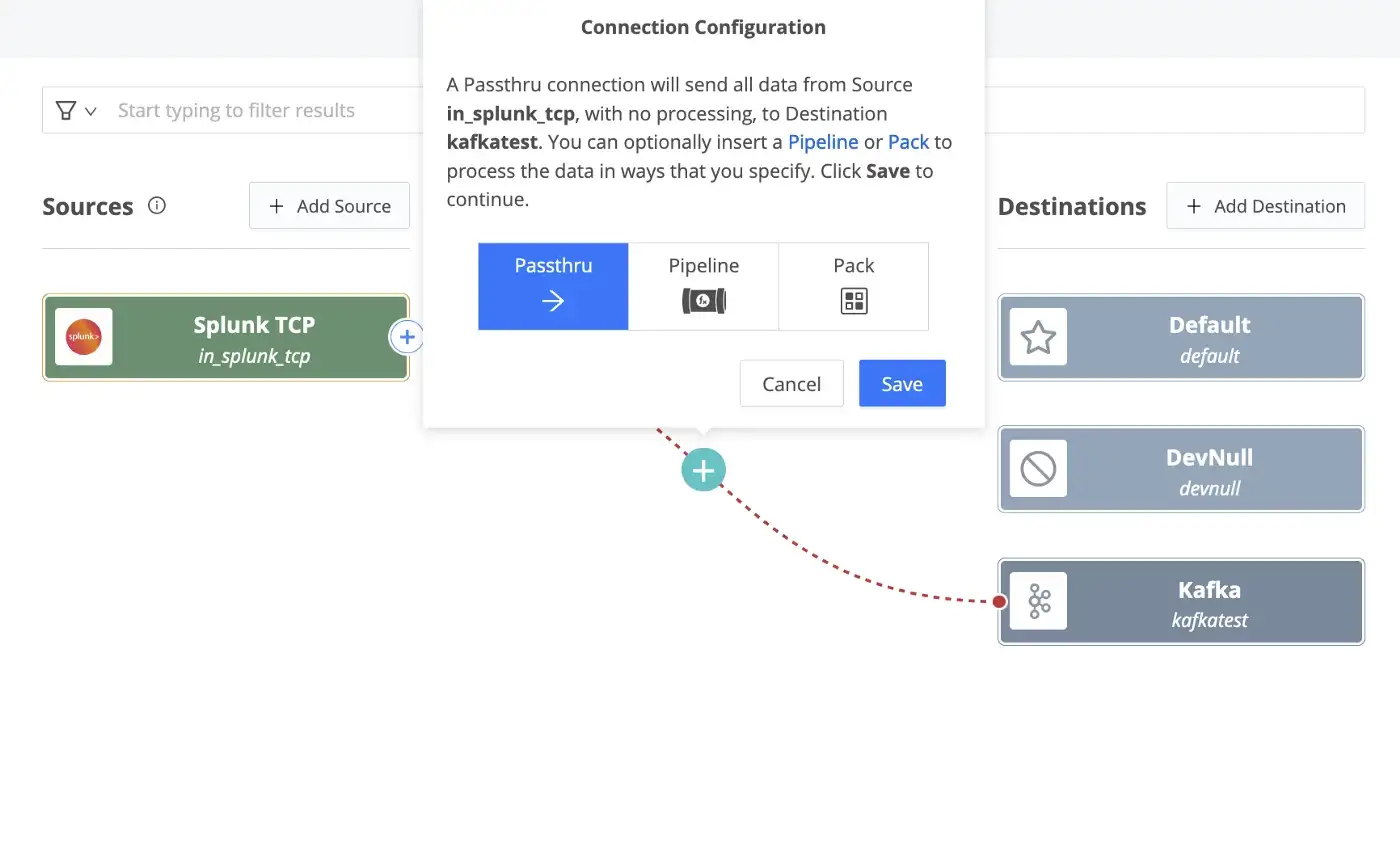
Without creating any pipelines (Passthru method), I simply dragged and connected the Splunk TCP source to the Kafka destination while monitoring the topic for inputs.
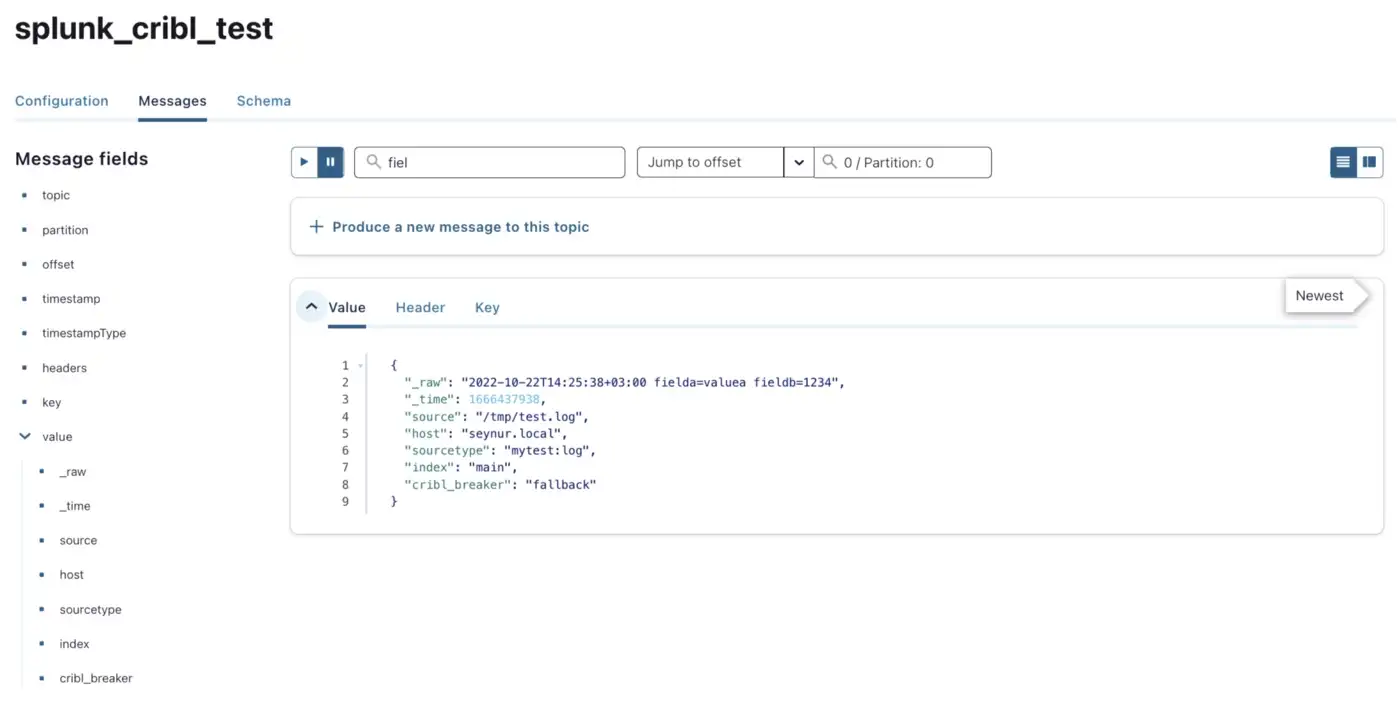
Similar to the Confluent Splunk S2S Connector test above, I was able to see all _internal index logs as well as any other input configured from the forwarder in the test topic (i.e. splunk_cribl_test).
echo "`date -Iseconds` fielda=valuea fieldb=1234" >> /tmp/test.log
4. Vector
Installing vector was pretty straightforward. It seems like Vector does not support Splunk protocol (e.g. S2S version of Confluent connector) but allows us to test with HEC. I have the following configuration for that purpose as the source and sending data to relevant Kafka topics.
$> cat config/test.toml
[sources.my_source_id]
type = "splunk_hec"
address = "0.0.0.0:8080"
token = "A94A8FE5CCB19BA61C4C08"
valid_tokens = [ "A94A8FE5CCB19BA61C4C08" ]
[sinks.my_sink_id]
type = "kafka"
inputs = [ "my_source_id" ]
bootstrap_servers = "127.0.0.1:9092"
topic = "splunk_vector_test"
compression = "none"
[sinks.my_sink_id.encoding]
  codec = "json"
$> bin/vector --config config/test.toml
Note that the above configuration for the HEC source is listening on HTTP (no SSL). By running the following curl command (same as the previous HEC test), I could send data to Vector and view the messages populated in the Kafka topic.
$> curl "http://127.0.0.1:8080/services/collector/event" -H "Authorization: Splunk A94A8FE5CCB19BA61C4C08" -d '{"sourcetype": "_json", "event": {"a": "value1", "b": ["value1_1", "value1_2"]}}'

Conclusion
Splunk Forwarder only supports sending events to other Splunk instances (S2S) while Splunk Connect For Syslog (SC4S) supports sending data over HTTP Event Collector (HEC). Confluent S2S Connector and Cribl are the only options tested above that support S2S; meaning that if you want to use Splunk Universal Forwarder to collect events and ingest those events to Kafka, you’ll need to utilize one of these options. Also, note that Splunk UF does not have routing functionality; so, you’ll end up sending all of the collected data (e.g. internal and any other configured inputs) to either Confluent S2S Connector or Cribl. Both solutions support routing and transformations. Confluent provides Single Message Transforms and Cribl has this capability built-in (e.g. routing, transformation, aggregation, filtering, etc.). With regards to configuration, I think Cribl has the upper hand with its easy-to-configure processing pipelines.
If you’d like to utilize HEC, note that HEC is supported by all of the above (Confluent, Cribl, Vector) options and my personal preference would be to go with Vector since it’s open-source and pretty simple to use. Vector also provides various processing functionality (e.g. routing, transformation, aggregation, filtering, etc.).
My mini-test was purely functional so I haven’t tested any of these tools under load; however, all of them pretty much documents supporting TBs of data during ingest without any issues with some benchmarks (and customers) to support these claims. My recommendation would be to review functionality according to your use cases and test integrations as well as operations (e.g. configuration changes, deployment, managing scalability, etc.).
Note that in some cases it may be a better long term commitment to switch to other log collection agents, especially open-source ones (e.g. beats, fluentd, telegraf, vector, etc.). One issue that comes with using such tools is configuration management in a distributed environment (e.g. 1000s of agents) and some organizations have utilized configuration management tools (e.g. ansible, puppet, chef, etc.) for this purpose. These tools are outside the scope of this post but please feel free to share your comments, thoughts, and recommendations.
References
- Configure forwarding with outputs.conf
- Splunk S2S Source Connector
- Splunk Source Connector
- Get started with Single Message Transforms for self-managed connectors
- Vector
- Cribl


