Real-Time Log Streaming with Fluent Bit and Kafka
Modern systems generate an enormous volume of logs across distributed Linux and Windows environments. As infrastructure scales, directly forwarding logs to a centralized platform can introduce bottlenecks, data loss risks, and operational complexity. To address these challenges, organizations need an architecture that is not only scalable but also resilient under high load and unexpected traffic spikes.
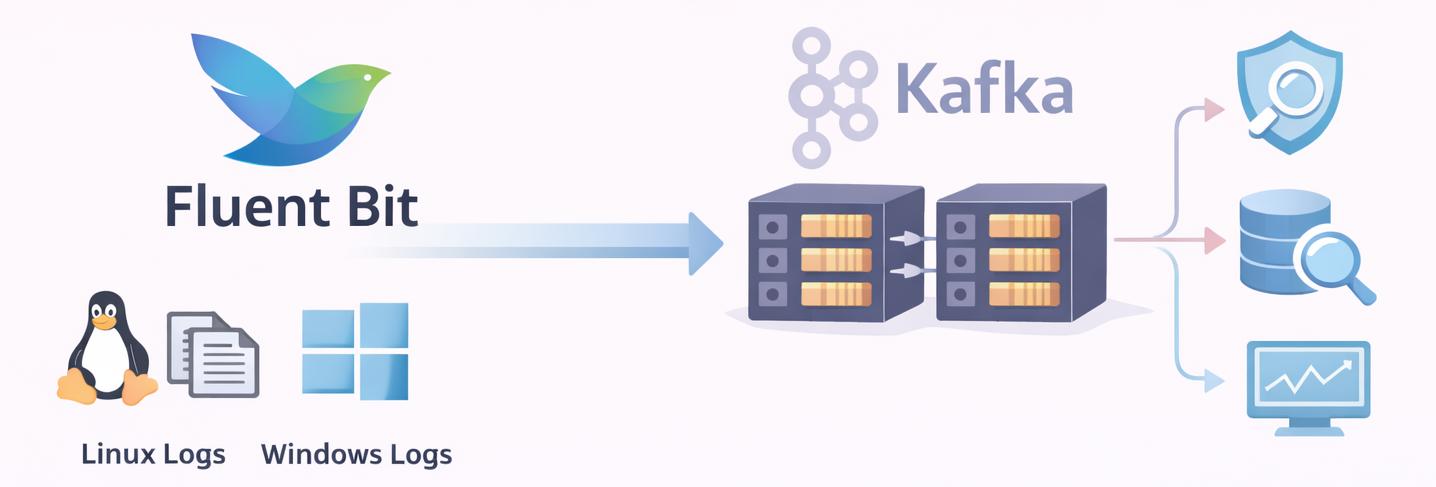
In this article, we will build a real-time log streaming pipeline using Fluent Bit and Apache Kafka. Fluent Bit will act as a lightweight edge agent to collect logs from Linux systems, while Kafka will serve as a scalable buffer and streaming backbone. By the end of this guide, you will have a working log pipeline that demonstrates how Fluent Bit and Kafka can be used together for real-time log streaming.
Architecture Overview
🫧 Fluent Bit
Fluent Bit is a lightweight, high-performance log processor designed for real-time data collection and forwarding. It is commonly deployed as the first stage of a logging pipeline, running close to the source to minimize resource usage while maintaining high throughput.
Fluent Bit is built around a modular pipeline architecture that enables efficient log collection and processing. Instead of handling logs as a single stream, Fluent Bit processes them through a series of stages, allowing each step to focus on a specific task within the pipeline.
The process begins with Input plugins, which collect logs from various sources such as log files, containers, system services, and Windows Event Logs. Once the logs are ingested, Parsers can be applied to transform raw log messages into structured data. This step is particularly important for converting unstructured text into meaningful fields that can be easily searched, filtered, and analyzed.
After parsing, the Filter layer provides additional processing capabilities. Filters can enrich log records with metadata, remove unnecessary fields, or apply conditional transformations. This stage allows logs to be cleaned, standardized, and prepared before they are forwarded to external systems.
Within the Fluent Bit pipeline, each log entry is represented as a record and assigned a tag. Tags play an important role in determining how records are routed through the pipeline, ensuring that logs reach the appropriate output destination.
Finally, processed records are delivered through Output plugins to external systems such as logging platforms, message queues, or storage backends.
In the architecture presented in this blog, Apache Kafka is used as the primary output destination, providing a scalable and reliable streaming backbone for the collected log data.
This modular approach makes Fluent Bit a highly efficient and flexible solution for log collection in modern, containerized, and distributed environments.
Fluent Bit Pipeline Components
To better understand how Fluent Bit processes log data, the pipeline can be summarized through the following components:
- Input → Collects logs from files, containers, and system sources
- Parser → Converts raw logs into structured data
- Filter → Enriches or transforms log records
- Tag → Labels records and determines routing
- Record → Represents the processed log entry inside Fluent Bit
- Output → Sends records to external systems such as Kafka
🫧 Apache Kafka
Kafka is a distributed streaming platform designed to handle high-throughput and fault-tolerant data pipelines.
In this architecture, Fluent Bit forwards collected log records to Kafka, where they are stored and streamed for further processing.
Kafka organizes data using topics, which act as logical channels for messages. Each topic is divided into multiple partitions, enabling parallel processing and horizontal scalability. These partitions are distributed across brokers, the servers that form the Kafka cluster. Replication across brokers ensures durability and high availability even if individual nodes fail.
Downstream systems read data from Kafka using consumers, which subscribe to topics and process incoming messages. Consumers are often organized into consumer groups, allowing multiple instances to process messages in parallel while balancing the workload.
By combining partitioning, replication, and consumer groups, Kafka provides a reliable and scalable backbone for streaming and processing the log data collected by Fluent Bit.
Kafka Message Flow Components
- Producer → Sends messages to a Kafka topic
- Topic → Logical channel used to organize messages
- Partition → Subdivision of a topic that enables parallel processing and scalability
- Broker → Kafka server responsible for storing partitions and handling read/write operations
- Consumer → Reads messages from topics for downstream processing
- Consumer Group → Group of consumers that share the workload of processing messages from a topic
Building the Real-Time Log Pipeline
After introducing the architecture and the core components, we can now move on to the implementation phase. In this section, we will build the real-time log pipeline step by step, starting with the deployment of Kafka.
🧩 Step 1: Deploy Kafka (KRaft Mode)
Kafka will run in KRaft mode, which removes the need for ZooKeeper and simplifies the overall setup. This mode is particularly convenient for local development and testing environments.
The following docker-compose.yml provides a minimal configuration for running a single-node Kafka broker in KRaft mode. The setup also includes Kafka UI, which allows us to inspect topics and monitor messages through a web interface.
# docker-compose.yml
# Goal: Run a single-node Kafka broker in KRaft mode for local testing.
# Includes Kafka UI for easy topic/message inspection.

services:
  broker:
    image: confluentinc/cp-kafka:7.9.0
    container_name: broker
    hostname: broker
    ports:
      - "9092:9092"   # External access from host/VMs
    environment:
      # ---- KRaft basics (no ZooKeeper) ----
      KAFKA_NODE_ID: 1
      KAFKA_PROCESS_ROLES: "broker,controller"
      KAFKA_CONTROLLER_QUORUM_VOTERS: "1@broker:29093"
      KAFKA_CONTROLLER_LISTENER_NAMES: "CONTROLLER"
      KAFKA_INTER_BROKER_LISTENER_NAME: "PLAINTEXT"

      # ---- Listeners ----
      # Kafka listens on:
      # - broker:29092 (internal Docker network)
      # - broker:29093 (KRaft controller)
      # - 0.0.0.0:9092 (external, mapped to your host)
      KAFKA_LISTENERS: "PLAINTEXT://broker:29092,CONTROLLER://broker:29093,PLAINTEXT_HOST://0.0.0.0:9092"
      KAFKA_LISTENER_SECURITY_PROTOCOL_MAP: "CONTROLLER:PLAINTEXT,PLAINTEXT:PLAINTEXT,PLAINTEXT_HOST:PLAINTEXT"

      # Advertised listeners = addresses returned to clients during metadata exchange.
      # - broker:29092 is used by other containers (Fluent Bit in Docker, Kafka UI, etc.)
      # - <your_host_ip>:9092 is used by external clients (Mac host, Linux VM, Windows VM)
      # IMPORTANT: Do NOT use localhost here if clients run outside this Docker host.
      KAFKA_ADVERTISED_LISTENERS: "PLAINTEXT://broker:29092,PLAINTEXT_HOST://<your_host_ip>:9092"

      # ---- Single-node replication settings ----
      KAFKA_OFFSETS_TOPIC_REPLICATION_FACTOR: 1
      KAFKA_TRANSACTION_STATE_LOG_MIN_ISR: 1
      KAFKA_TRANSACTION_STATE_LOG_REPLICATION_FACTOR: 1
      KAFKA_GROUP_INITIAL_REBALANCE_DELAY_MS: 0

      # Storage for KRaft metadata + logs
      KAFKA_LOG_DIRS: "/tmp/kraft-combined-logs"

      # Cluster ID required by KRaft
      # Generate with: kafka-storage.sh random-uuid
      CLUSTER_ID: "MkU3OEVBNTcwNTJENDM2Qk"

  kafka-ui:
    image: provectuslabs/kafka-ui:latest
    container_name: kafka-ui
    depends_on:
      - broker
    ports:
      - "8080:8080"
    environment:
      KAFKA_CLUSTERS_0_NAME: "local"
      # Kafka UI is inside Docker, so it connects via the internal listener:
      KAFKA_CLUSTERS_0_BOOTSTRAPSERVERS: "broker:29092"
Start the Kafka environment using Docker Compose:
docker compose up -d
⚠️ When running Kafka inside Docker, the
advertised.listenersconfiguration must be set carefully. Avoid usinglocalhostfor external access.During the metadata exchange process, Kafka returns the address defined in advertised.listeners to clients. External clients will then attempt to connect to that address. If localhost is used, clients outside the container network will not be able to reach the broker.
Instead, configure advertised.listeners with a reachable IP address or hostname that clients can access.
🧩 Step 2: Create a Topic for Log Streaming
After Kafka is running, the next step is to create a topic that will receive the logs forwarded by Fluent Bit.
- First, access the Kafka broker container:
docker exec -it broker /bin/bash
- Create a topic for Linux log data:
kafka-topics --create \
--topic lab_linux_logs \
--partitions 3 \
--replication-factor 1 \
--bootstrap-server localhost:9092
- Verify that the topic has been created successfully:
kafka-topics --list \
--bootstrap-server localhost:9092
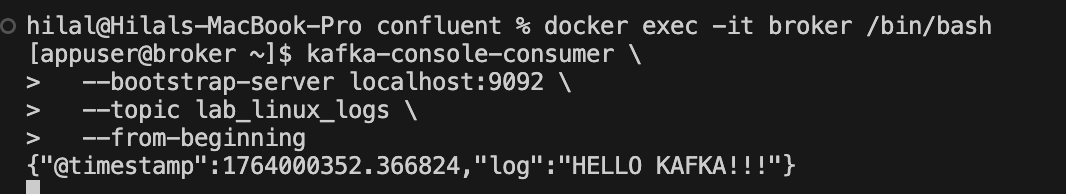
- To confirm that messages are flowing into Kafka, start a console consumer and listen to the topic:
kafka-console-consumer \
--bootstrap-server localhost:9092 \
--topic lab_linux_logs \
--from-beginning
This consumer will display incoming messages in real time, allowing you to verify that log records are successfully being written to the topic.
🧩 Step 3: Install and Start Fluent Bit Agent
For demonstration purposes, Fluent Bit will collect logs from a simple test file. In real-world environments, this configuration can easily be adapted to collect logs from system services, application logs, or container workloads.
In this guide, Fluent Bit is installed on Ubuntu 24.04 LTS (Noble) following the recommended secure deployment approach using the official Fluent Bit repository.
- Add the Fluent Bit server GPG key to your keyring to ensure you can get the correct signed packages:
curl https://packages.fluentbit.io/fluentbit.key | \
sudo gpg --dearmor -o /usr/share/keyrings/fluentbit-keyring.gpg
- Add the Fluent Bit Repository:
echo "deb [signed-by=/usr/share/keyrings/fluentbit-keyring.gpg] https://packages.fluentbit.io/ubuntu/noble noble main" \ | sudo tee /etc/apt/sources.list.d/fluent-bit.list
- Update the package list and install Fluent Bit:
# Update the package list:
sudo apt update

# Install Fluent Bit:
sudo apt install fluent-bit
- Start and Verify the Service:
# Start the Fluent Bit service:
sudo systemctl start fluent-bit

# Verify that the service is running:
sudo systemctl status fluent-bit
- Monitor Logs for Troubleshooting:
journalctl -u fluent-bit -f
This command allows you to monitor Fluent Bit activity and quickly identify configuration or connectivity issues.
🧩 Step 4: Generate Sample Log Data
- To demonstrate the pipeline, we will generate a simple test log file that Fluent Bit will monitor:
cd /var/log/sudo touch test.log - Append a sample log entry:
echo "HELLO KAFKA!!!" >> /var/log/test.log
This file (/var/log/test.log) will be continuously tailed by Fluent Bit and forwarded to Kafka.
🧩 Step 5: Configure Fluent Bit
- First, open the main Fluent Bit configuration file for editing:
sudo vi /etc/fluent-bit/fluent-bit.conf - Then, update the configuration as follows:
[SERVICE]
    Flush 1
    Daemon Off
    Log_Level info

[INPUT]
    Name tail
    Path /var/log/test.log
    Tag linux.syslog
    Read_from_Head true

[OUTPUT]
    Name kafka
    Match linux.syslog
    Brokers <your_mac_ip>:9092
    Topics lab_linux_logs
In this configuration:
Input tails the test log file
Tag identifies the log stream
Output sends the records to the Kafka topic
lab_linux_logs
- After saving the configuration, restart Fluent Bit to apply the changes:
sudo systemctl restart fluent-bitsudo systemctl status fluent-bit
🧩 Step 6: Validate the End-to-End Pipeline
If the pipeline is configured correctly, the existing log entries should appear in the Kafka consumer output.
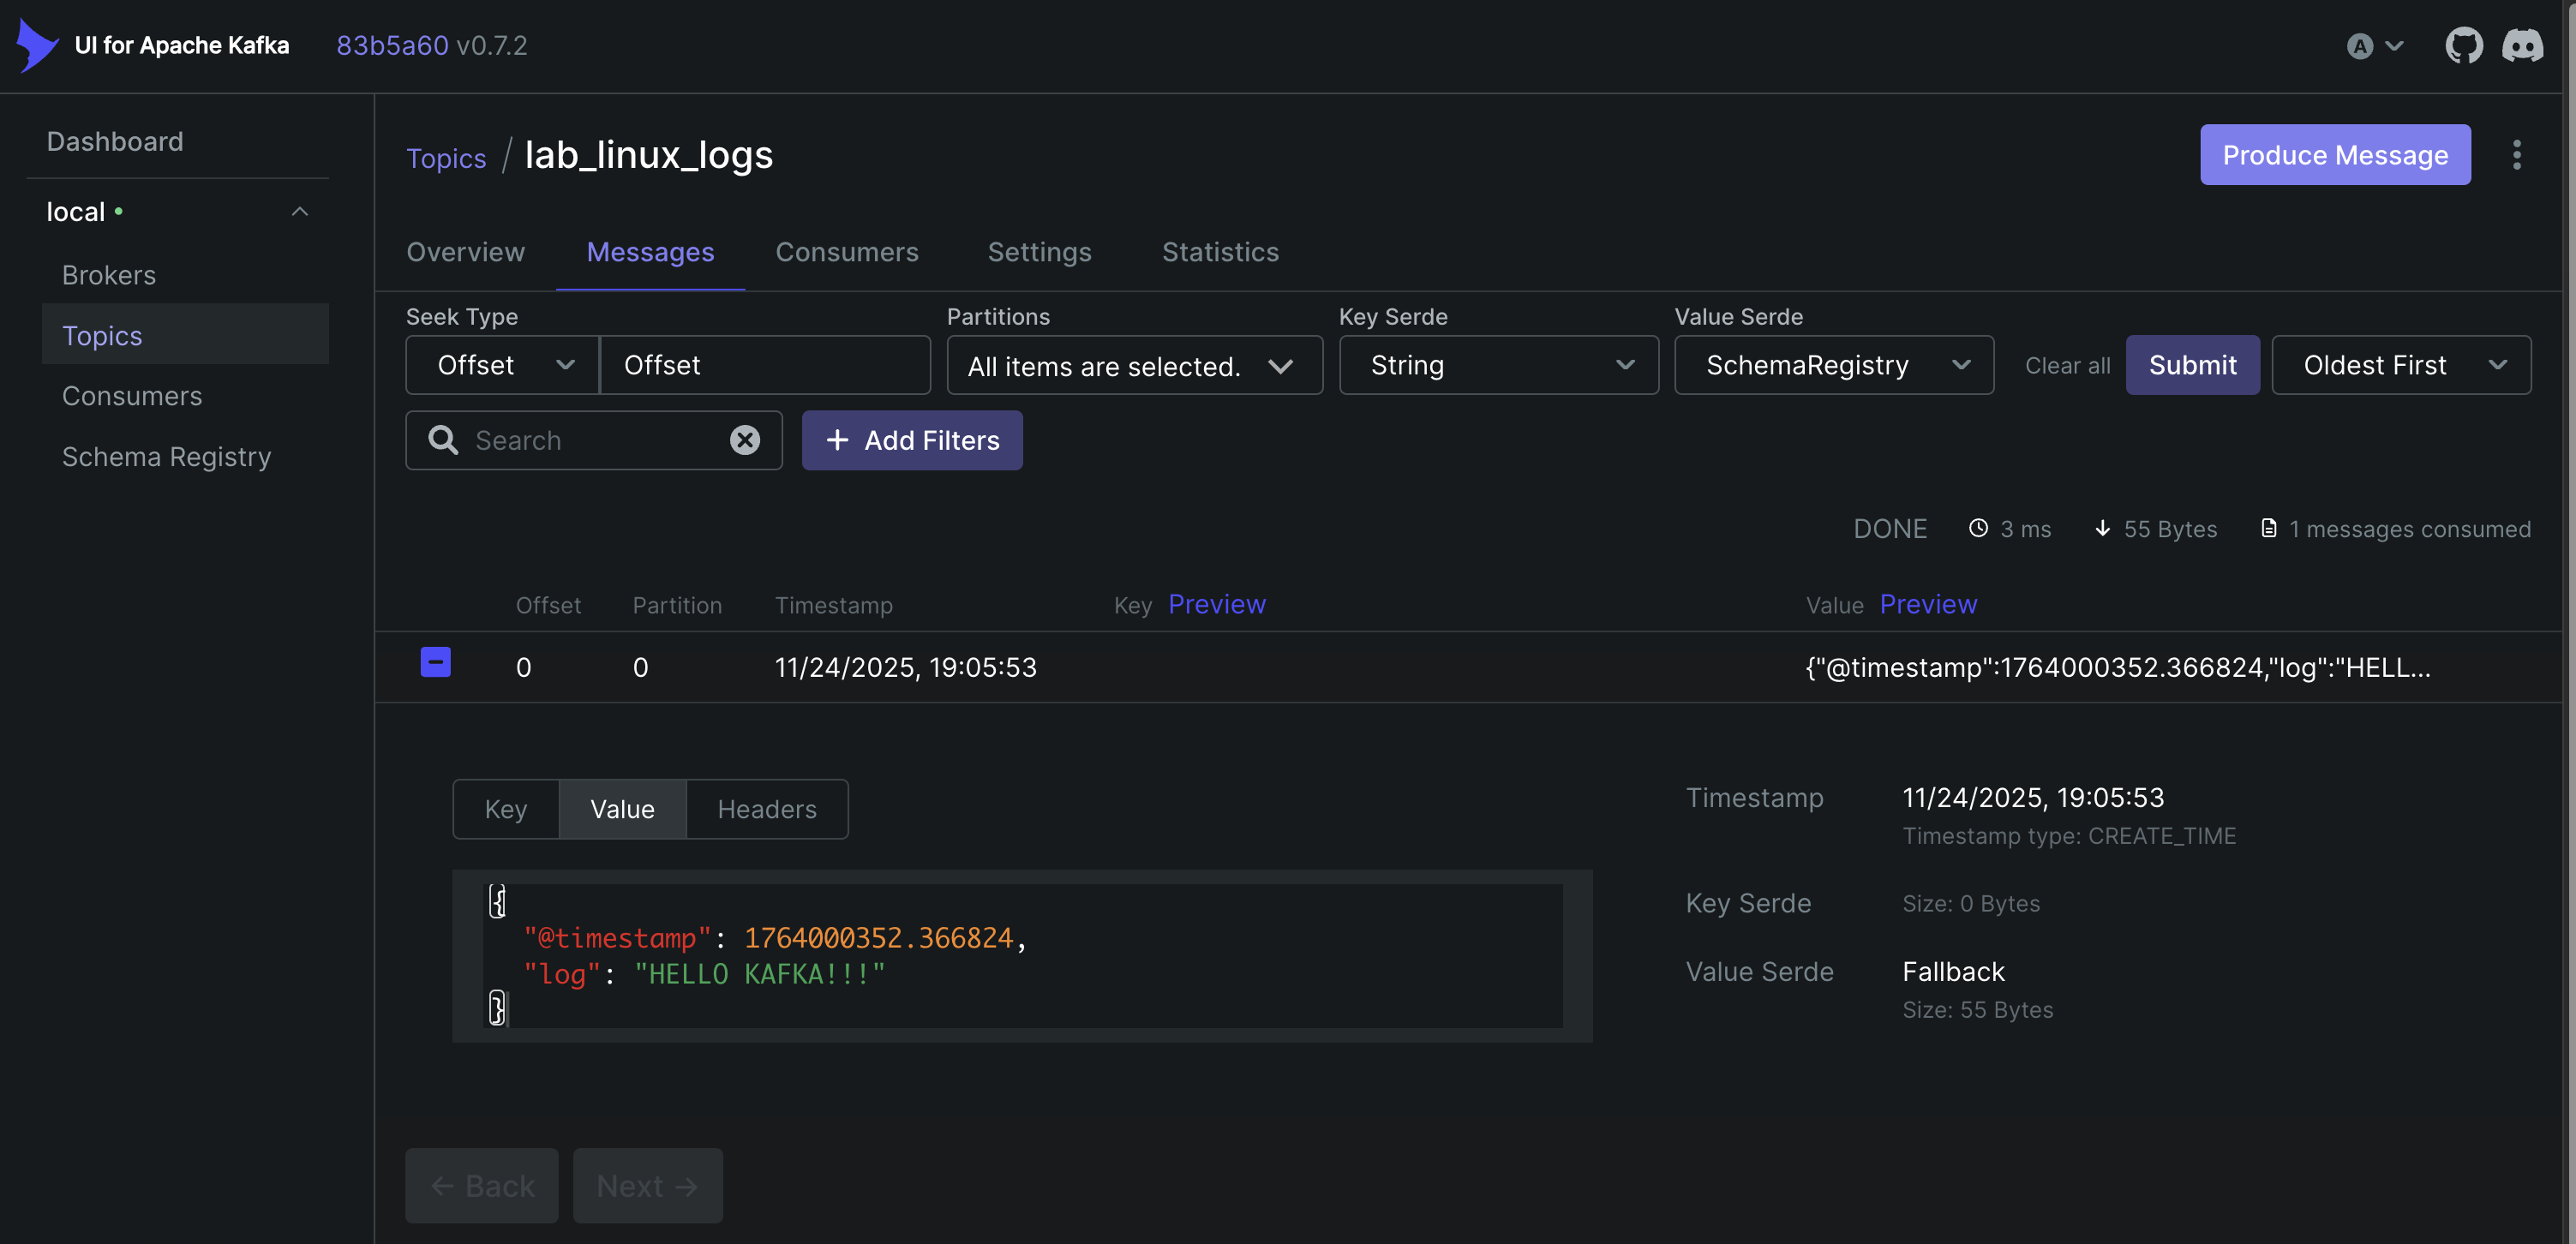
You can also inspect the messages through the Kafka UI available in the Docker environment.
To further verify that the pipeline is working in real time, you can append a new log entry to the test file:
echo "NEW LINUX LOG ENTRY" >> /var/log/test.log
The new message should immediately appear in the consumer output, confirming that Fluent Bit is successfully forwarding logs to Kafka.
Conclusion
This guide demonstrated how to build a real-time log streaming pipeline using Fluent Bit and Apache Kafka. By combining lightweight log collection with a scalable streaming platform, this architecture provides a flexible foundation for processing log data in modern distributed environments.
As a next step, this pipeline can be extended by integrating downstream systems such as log analytics platforms, SIEM solutions, or data processing pipelines to analyze and visualize the streamed log data.