From Sysmon to Splunk: Building a Linux Detection Pipeline (End-to-End)
🚀 1. Introduction
Sysmon has been serving as an important component of endpoint visibility on Windows machines for several years now. The equivalent for Linux has been around for a few years too, although its adoption was not always widespread [1].
However, visibility on Linux had mostly depended on a blend of the use of auditd, manual logging pipelines, and tools utilizing the capabilities of eBPF. Recently, Sysmon for Linux has seen increased usage as a telemetry standardization layer [2].
Rather than combining several sources, Sysmon for Linux provides all of the above in one unified place, resembling the approach taken in Windows environments.
In this guide, we will create a complete solution where Sysmon is installed on Ubuntu, its logs are forwarded to Splunk. Additionally, we will make sure that this data conforms to Splunk’s CIM standard, ready to be analyzed straight away.
2. What We’re Building
Before diving into instructions, let us clarify our objective quickly.
Our objective is very straightforward:
👉 capture Linux data and make it searchable in Splunk (CIM-compatible version, of course). Rather than using ad-hoc logs, we will develop a well-defined workflow:
- Sysmon captures Linux events (process events, network events, file events)
- These events are captured using rsyslog (if you desire, you can use syslog-ng) and stored in a specific log file (/var/log/sysmon.log)
- Splunk universal forwarder captures these events from the specific log file
- Events are transferred to Splunk with CIM-compatible
The result?
A robust visibility pipeline that serves the objective of security use-cases.
There are two options for installing this package:
-
Automatic installation (preferred):
You may use the installation script we’ve provided to automatically install everything at once using one command. This will be the quickest method for deployment, especially if you intend to use this on more than one server.
-
Manual installation (installation guide):
Otherwise, you may manually install each of these components following the commands provided below. This is a good way to learn about the installation process.
👉 For Installation Script & Splunk app: https://github.com/seynur/seynur-demos/tree/main/microsoft/microsoft_sysmon_for_linux
2.1. Automatic Sysmon Installation
If you wish to configure everything in just a few steps, you can use the automatic installation script provided below.
The script performs the following actions:
- Installation of necessary packages
- Configuration of the Microsoft repository
- Installation of Sysmon for Linux
- Application of pre-configured detection settings
- Enabling and starting of the Sysmon service
- Configuring rsyslog to log to /var/log/sysmon.log
- Verification of correct operation
Everything will be performed in one batch.
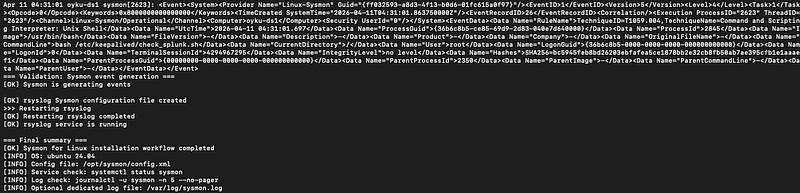
curl -sSL https://raw.githubusercontent.com/seynur/seynur-demos/main/microsoft/microsoft_sysmon_for_linux/sysmon-linux-installation_deb_ubuntu.sh | sudo bash
 |
|---|
| Figure 1: The script results. |
2.2. Step-by-Step Sysmon Installation
2.2.1. Preparing the System
Before installing anything, we need to ensure the system has the necessary basic packages.
These are mostly standard utilities required for package management and secure repository management.
sudo apt update
sudo apt install -y wget curl gnupg apt-transport-https ca-certificates
2.2.2. Installing Sysmon for Linux
Sysmon for Linux is distributed via Microsoft’s package repository, so we first need to add it.
cd /tmp
wget https://packages.microsoft.com/config/ubuntu/24.04/packages-microsoft-prod.deb
sudo dpkg -i packages-microsoft-prod.deb
sudo apt install -y sysinternalsebpf sysmonforlinux
Now we can install Sysmon and its eBPF dependency:
sudo apt install -y sysinternalsebpf sysmonforlinux
At this point, Sysmon is installed, but it’s not doing anything yet. It needs a configuration to define what we actually want to monitor.
2.2.3. Creating a Detection Configuration
That’s where things get really interesting. Unlike logging applications by default, Sysmon is based on rules. It’s your choice what to monitor, and disregard everything else.
For our purposes, we will make use of a specific, generic config file containing: Executions from the shell (bash, sh) Network utilities (curl, wget, ssh) File operations (/tmp, authorized_keys) Disk usage
Make your configuration file:
mkdir -p /opt/sysmon
cat > /opt/sysmon/config.xml <<'EOF'
<Sysmon schemaversion="4.90">
  <EventFiltering>

    <!-- ========================= -->
    <!-- Process Creation (EventID 1) -->
    <!-- ========================= -->
    <RuleGroup name="process_create" groupRelation="or">
      <ProcessCreate onmatch="include">

        <!-- Shell usage -->
        <Image condition="end with">/bin/bash</Image>
        <Image condition="end with">/bin/sh</Image>
        <Image condition="end with">/bin/dash</Image>

        <!-- Common tool transfer -->
        <Image condition="end with">curl</Image>
        <Image condition="end with">wget</Image>
        <Image condition="end with">ftpget</Image>
        <Image condition="end with">tftp</Image>

        <!-- Suspicious temp execution -->
        <Image condition="begin with">/tmp/</Image>
        <Image condition="begin with">/dev/shm/</Image>

        <!-- Account manipulation -->
        <Image condition="end with">useradd</Image>
        <Image condition="end with">adduser</Image>

        <!-- Permission changes -->
        <Image condition="end with">chmod</Image>
        <Image condition="end with">chown</Image>

      </ProcessCreate>
    </RuleGroup>

    <!-- ========================= -->
    <!-- Network Connections (EventID 3) -->
    <!-- ========================= -->
    <RuleGroup name="network_connect" groupRelation="or">
      <NetworkConnect onmatch="include">
        <Image condition="end with">curl</Image>
        <Image condition="end with">wget</Image>
        <Image condition="end with">ssh</Image>
      </NetworkConnect>
    </RuleGroup>

    <!-- ========================= -->
    <!-- Process Termination (EventID 5) -->
    <!-- ========================= -->
    <RuleGroup name="process_terminate" groupRelation="or">
      <ProcessTerminate onmatch="include" />
    </RuleGroup>

    <!-- ========================= -->
    <!-- Raw Disk Access (EventID 9) -->
    <!-- ========================= -->
    <RuleGroup name="raw_access" groupRelation="or">
      <RawAccessRead onmatch="include" />
    </RuleGroup>

    <!-- ========================= -->
    <!-- File Creation (EventID 11) -->
    <!-- ========================= -->
    <RuleGroup name="file_create" groupRelation="or">
      <FileCreate onmatch="include">

        <!-- Temp directory activity -->
        <TargetFilename condition="begin with">/tmp/</TargetFilename>

        <!-- SSH persistence -->
        <TargetFilename condition="end with">authorized_keys</TargetFilename>

        <!-- Cron persistence -->
        <TargetFilename condition="begin with">/etc/cron</TargetFilename>

        <!-- Systemd persistence -->
        <TargetFilename condition="begin with">/etc/systemd/system</TargetFilename>

      </FileCreate>
    </RuleGroup>

    <!-- ========================= -->
    <!-- File Deletion (EventID 23) -->
    <!-- ========================= -->
    <RuleGroup name="file_delete" groupRelation="or">
      <FileDelete onmatch="include" />
    </RuleGroup>

  </EventFiltering>
</Sysmon>
EOF
2.2.4. Starting Sysmon
Now we activate Sysmon with our configuration & quick validation.
sudo sysmon -i /opt/sysmon/config.xml
sudo systemctl enable sysmon
sudo systemctl start sysmon

systemctl status sysmon
journalctl -u sysmon -n 10 --no-pager
If everything is working, you should start seeing events generated by Sysmon.
2.2.5. (Optional) Routing Logs to a File
By default, Sysmon logs go into journald. That’s fine, but not ideal for log forwarding.
Instead, we route them into a dedicated file:
cat > /etc/rsyslog.d/sysmon.conf <<'EOF'
if $programname == 'sysmon' then /var/log/sysmon.log
& stop
EOF
sudo systemctl restart rsyslog
tail -f /var/log/sysmon.log
2.3. Sending Data to Splunk
Now comes the fun part: getting this data into Splunk. Whether you install it manually or via script, it doesn’t matter; this section covers both.
Install and start the Splunk Universal Forwarder, then configure it with the example below.
# inputs.conf
[monitor:///var/log/sysmon.log]
index = osnix
sourcetype = linux:sysmon
To make the data easier to work with, we define basic great 6 & search time enrichments on props.conf & transforms.conf. 👉 You can download the app: https://github.com/seynur/seynur-demos/tree/main/microsoft/microsoft_sysmon_for_linux/oyku_linux_sysmon_props
oyku_linux_sysmon_props/
│
├── local/
│   ├── app.py
│   ├── eventtypes.py
│   ├── props.py
│   ├── tags.py
│   └── transforms.py
|
|
└── metadata/
    └── local.meta
You should add this app into your indexer(s)/search head(s). Now comes the important part:
👉 Are we actually getting usable, structured data?
Let’s validate it with the SPL below:
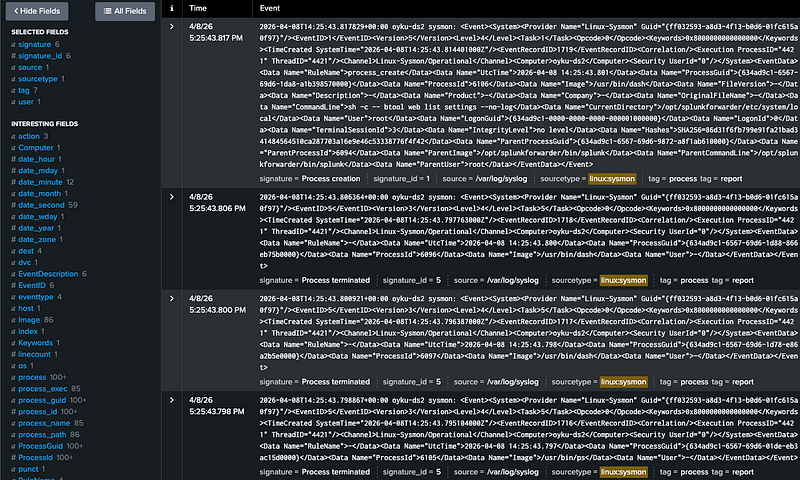
index = osnix sourcetype="linux:sysmon"
At this stage, your Splunk interface should show:
- Cleanly parsed fields on the left panel
- Event data broken into meaningful key-value pairs
- No need to manually extract XML fields
- Consistent field naming across events
👇 Example view:
|  |
|:–:|
| Figure 2: Image of the SPL results. |
|
|:–:|
| Figure 2: Image of the SPL results. |
Even normal system activity, such as Splunk checking its own configuration, is captured by Sysmon. This highlights the level of visibility you can achieve into process execution, including full command-line details and parent-child relationships.
3. Final Thoughts
By now, you should have a complete pipeline:
- Sysmon collecting activity from Linux
- Logging activity in a structured manner
- Feeding logs into Splunk for parsing and ingestion
- Events that can be searched, analyzed, and detected
This pipeline is a good starting point for expanding the visibility on Linux machines with minimal overhead. But the possibilities don’t stop here.
To get more insight into what’s happening, simulate different attack vectors and look at them in Splunk. For instance:
- Download tools using curl or wget
- Create files in the /tmp directory
- Run shell commands or spawn processes
- Alter system files or cron jobs
In doing so, you’ll gain the ability to:
- Test your Sysmon configuration
- Enhance detection capabilities
- Design better dashboards and alerts
If you’ve made it this far, congratulations! 🎉 You have a clean, effective, and flexible telemetry pipeline for your Linux machines using Sysmon and Splunk.
Have you tried this pipeline? Do you have any suggestions for making improvements?
💬 I’m eager to hear your thoughts, ideas, or any questions you might have! Feel free to connect with me on LinkedIn 🧚🏽♀️
Until next time 👋
4. References
[1] Microsoft. (n.d.). Sysmon documentation. Microsoft Learn. Retrieved from https://learn.microsoft.com/en-us/sysinternals/downloads/sysmon
[2] Microsoft. (n.d.). Sysmon for Linux. GitHub. Retrieved from https://github.com/microsoft/SysmonForLinux
[3] Seynur (2026). Sysmon for Linux installation and Splunk integration demo. GitHub. Retrieved from https://github.com/seynur/seynur-demos/tree/main/microsoft/microsoft_sysmon_for_linux
[4]SwiftOnSecurity. (n.d.). Sysmon configuration. GitHub. Retrieved from https://github.com/SwiftOnSecurity/sysmon-config