Detecting Cyber Threats with MITRE ATT&CK App for Splunk — Part 3
In this part of the blog series I’d like to focus on writing custom correlation rules. The goal is to utilize MITRE ATT&CK App for Splunk and enrich its abilities by adding pertinent correlation rules that correspond to techniques within MITRE ATT&CK Framework.
Part 1 of this blog post can be found here.
Part 2 of this blog post can be found here.
Where to begin?
It is possible to find various valuable sources for this but I’d like to start with what’s provided by the creators for the framework: MITRE Cyber Analytics Repository.
The MITRE Cyber Analytics Repository (CAR) is a knowledge base of analytics developed by MITRE based on the MITRE ATT&CK adversary model.
CAR website provides valuable information and keeps it relatively simple. It has 3 parts: analytics, data model, and sensors. I’d like to provide brief descriptions for each as well as their applicability to this context.
Analytics: Provides ATT&CK techniques, implementation details and applicable platform information. We will focus on the detailed Full Analytic List for the purposes of creating correlation rules. There are also tools such as CAR Exploration Tool (CARET) and ATT&CK Navigator layer for exploration.
Data Model: CAR defines data model as an organization of objects (e.g. hosts, files, connections, etc.), where each object is identified by actions (e.g. create, delete, modify, etc.) and fields (e.g. user, file_name, pid, etc.). Most of these are mapped via Splunk Common Information Model Add-On . We will focus on using Splunk CIM for analysis.
Sensors: These are sources of data collected for analytics. We are mainly focusing on sysmon data. Splunk Add-On for Microsoft Sysmon should be used to get such data into Splunk.
Basically, at this point our assumption is that we have Microsoft Sysmon data in Splunk and it is properly extracted and mapped to CIM (e.g. ). Next step would be to pick an analytic use-case from CAR Full Analytic List and implement it with Splunk SPL.
Writing correlation searches
Analytic List comes with implementation details and some of those include Splunk rules as well. For ease of implementation and comparison, let’s pick one that has SPL in place: CAR-2013–05–004: Execution with AT
I recommend visiting the link to see the level of detail it provides. This detection query checks the usage of Windows built-in command AT (at.exe) to schedule commands on Windows systems and matches Scheduled Task/Job technique (T1053).
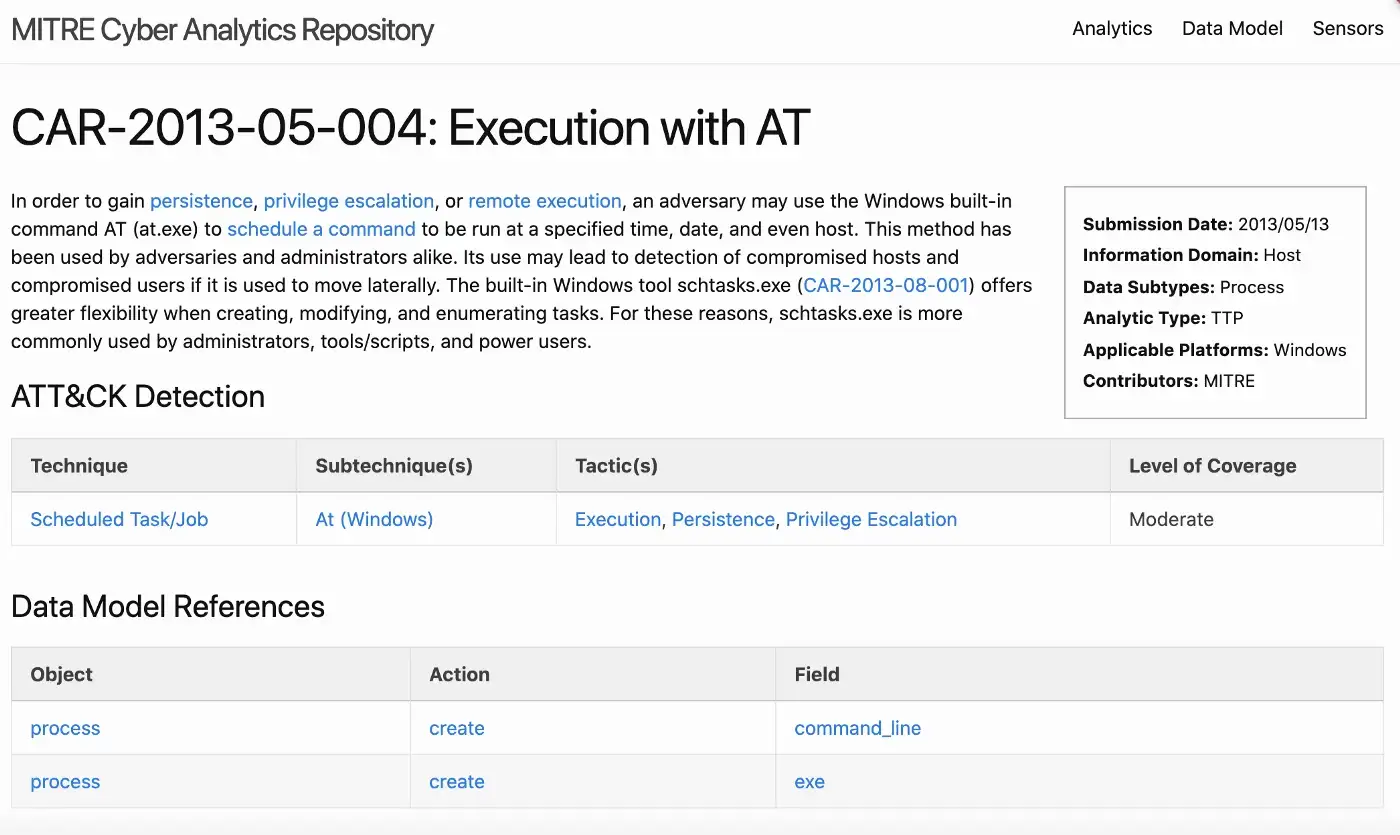
Under implementations section we can see a pseudocode and Splunk version as well.
Pseudocode:
process = search Process:Create
at = filter process where (exe == "at.exe")
output at
Splunk SPL:
index=__your_sysmon_index__ Image="C:\\Windows\\*\\at.exe"|stats values(CommandLine) as "Command Lines" by ComputerName
Obviously, you can simply copy/paste the above search into your environment to get things rolling; however, this search still performs a lot of search-time operations and does not take advantage of Splunk Common Information Model and Data Models. It is generally considered a “best practice” to utilize tstats (if possible) in order to take advantage of indexed fields in tsidx files.
Looking at the pseudocode (or SPL), detection search needs to check for a created process and match “at.exe” within the process path. Let’s use Endpoint data model to accomplish the same task. Splunk Add-On for Microsoft Sysmon makes Sysmon data available as Endpoint Processes dataset; hence we can use it as following:
| tstats count FROM datamodel=Endpoint.Processes WHERE Processes.action="allowed" AND Processes.process_path = "C:\\Windows\\*\\at.exe" by Processes.process_name Processes.process_path Processes.process Processes.parent_process_name Processes.dest Processes.user
If you have Data Model Acceleration enabled, then you can also utilize summariesonly=true parameter for tstats command. Such optimizations already come with Splunk Enterprise Security helper macros, hence we can actually re-write the query as following:
| tstats `security_content_summariesonly` count min(_time) as firstTime max(_time) as lastTime FROM datamodel=Endpoint.Processes WHERE Processes.action="allowed" AND Processes.process_path = "C:\\Windows\\*\\at.exe" by Processes.process_name Processes.process_path Processes.process Processes.parent_process_name Processes.dest Processes.user | `drop_dm_object_name(Processes)` | `security_content_ctime(firstTime)` | `security_content_ctime(lastTime)`
Now that we have our SPL ready, we need to test this to verify whether the rule is working properly.
I need sample data to test
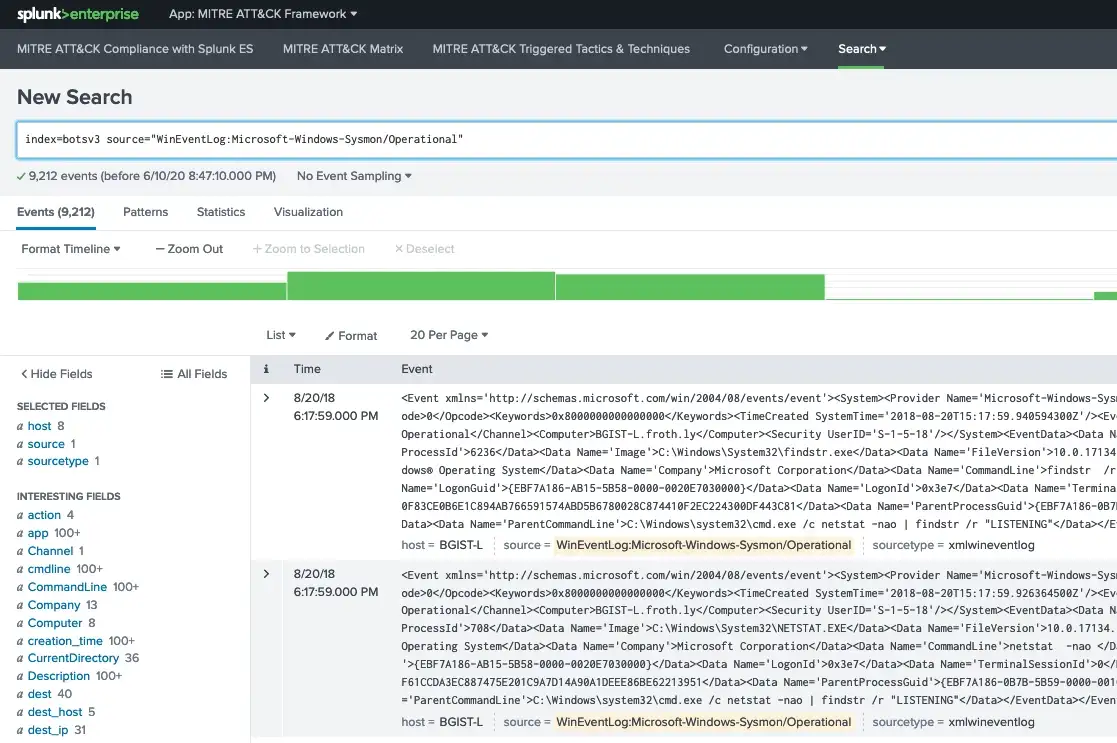
Easiest way to start would be utilizing Splunk’s Boss of the SOC (BOTS) data set on github. All you have to do is download this dataset and place it under $SPLUNK_HOME/etc/apps folder. The data comes pre-indexed, so you don’t have to do anything extra to ingest it. Having said that, since this dataset contains various sources/sourcetypes you’ll need to install additional add-ons in order to properly view extracted fields. For the purposes of sysmon, all we need is Splunk Add-On for Microsoft Sysmon to be installed.
If you need more data, perhaps Mordor would be a good resource as well. The dataset provided here is in JSON format and includes many sourcetypes. Since JSON is already extracted, all we have to do is tell Splunk that this is JSON and point to where the timestamp is for extraction (so that we get the correct timestamp for the event).
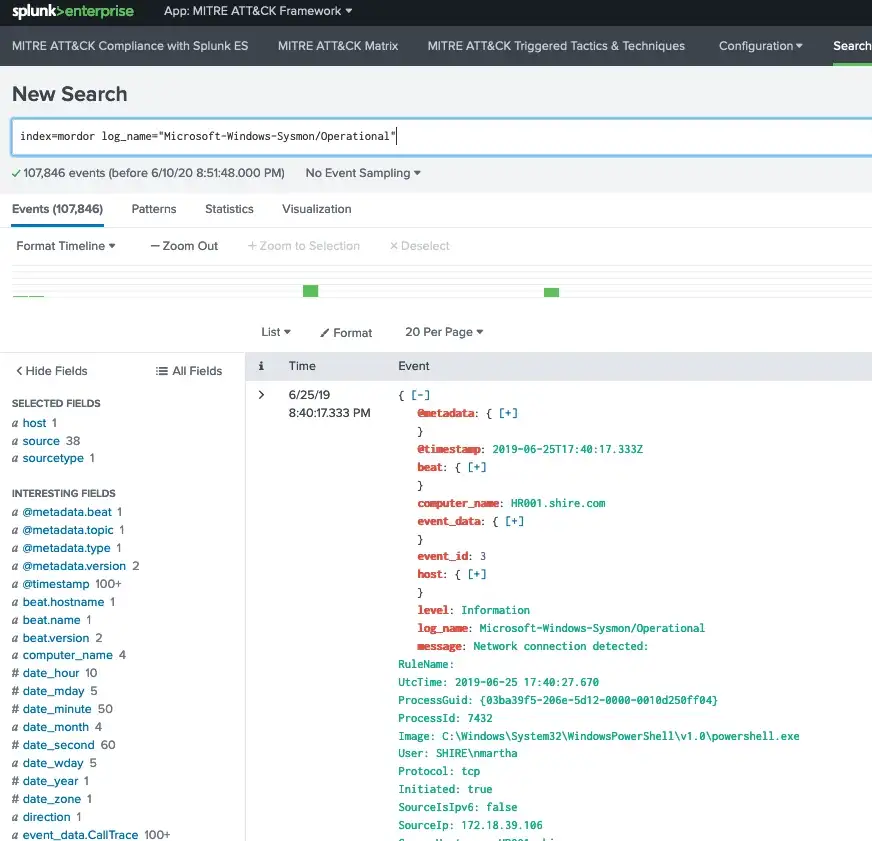
I used the following simple approach by editing under Sysmon Add-on (because I was lazy and it’s easier to copy/paste within the same file :) ):
TA-microsoft-sysmon/local/props.conf
[mordor:json]
SHOULD_LINEMERGE = false
KV_MODE=json
TIME_PREFIX=\"@timestamp\":
FIELDALIAS-EventCode1 = EventID AS EventCode
FIELDALIAS-EventCode2 = event_id AS EventCode
... copy/paste the FIELDALIAS/EVAL here...
In order to match this sysmon data with Splunk Endpoint, we need the correct field names and easiest way to do is to copy/paste the FIELDALIAS and EVAL attributes from Sysmon Add-on (namely [source::XmlWinEventLog:Microsoft-Windows-Sysmon/Operational] stanza).
In addition to the above extraction related changes, I updated the following file so that we have this additional data matching to Endpoint Data Model (tags).
TA-microsoft-sysmon/local/eventtypes.conf
[ms-sysmon-network]
search = ((index=mordor log_name="Microsoft-Windows-Sysmon/Operational") OR source="*WinEventLog:Microsoft-Windows-Sysmon/Operational") EventCode="3"

[ms-sysmon-process]
search = ((index=mordor log_name="Microsoft-Windows-Sysmon/Operational") OR source="*WinEventLog:Microsoft-Windows-Sysmon/Operational") (EventCode="1" OR EventCode="5" OR EventCode="6" OR EventCode="8" OR EventCode="9" OR EventCode="10" OR EventCode="15" OR EventCode="17" OR EventCode="18")

[ms-sysmon-filemod]
search = ((index=mordor log_name="Microsoft-Windows-Sysmon/Operational") OR source="*WinEventLog:Microsoft-Windows-Sysmon/Operational") (EventCode="11" OR EventCode="2")

[ms-sysmon-regmod]
search = ((index=mordor log_name="Microsoft-Windows-Sysmon/Operational") OR source="*WinEventLog:Microsoft-Windows-Sysmon/Operational") (EventCode="12" OR EventCode="13" OR EventCode="14")

[ms-sysmon-wmimod]
search = ((index=mordor log_name="Microsoft-Windows-Sysmon/Operational") OR source="*WinEventLog:Microsoft-Windows-Sysmon/Operational") (EventCode="19" OR EventCode="20" OR EventCode="21")

[ms-sysmon-dns]
search = ((index=mordor log_name="Microsoft-Windows-Sysmon/Operational") OR source="*WinEventLog:Microsoft-Windows-Sysmon/Operational") EventCode="22"
Now we have sample attack data from 2 different datasets for analysis of sysmon. You can also utilize Eventgen app to generate more custom data and feed into Splunk.
Create and map correlation search to technique
Once we are satisfied with our search and tested against some data, we can now create a correlation search in Enterprise Security App. This tutorial provides the steps
- Part 1: Plan the use case for the correlation search.
- Part 2: Create a correlation search.
- Part 3: Create the correlation search in guided mode.
- Part 4: Schedule the correlation search.
- Part 5: Choose available adaptive response actions for the correlation search.
Here’s a screenshot of the above search created as an Enterprise Security correlation search that runs every 5 minutes and searches the last 24 hours for activity.
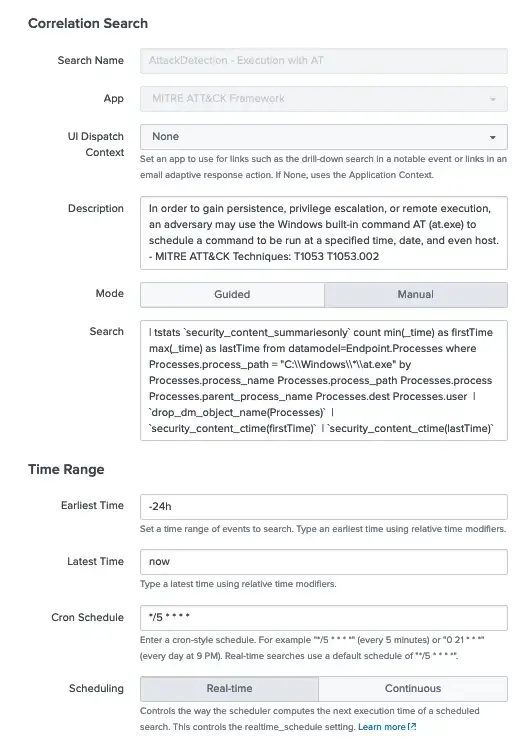
One thing to note, we must add Notable Adaptive Response Action so that if this search detects any activity it appears on our dashboards.
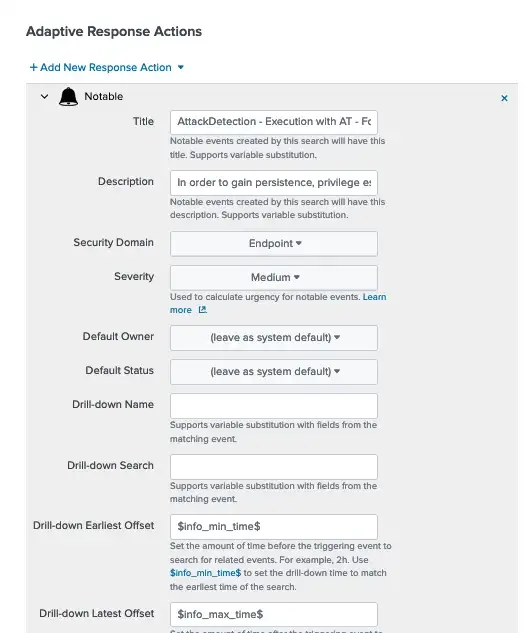
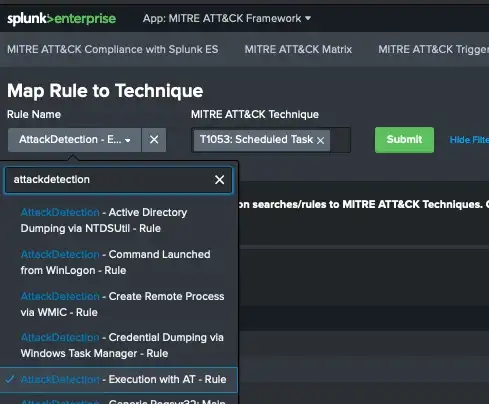
If we want this rule to appear as part of MITRE ATT&CK App dashboards, we need to associate it with one ore more technique(s). This is explained in Part2 of the series in detail. Here’s a screenshot from Map Rule to Technique view.
If that seems like a lot of work, please read on…
New feature: Attack Detection API Integration
Starting with version 2.2.0, we’ve added a new feature to integrate MITRE ATT&CK App for Splunk with our Attack Detection API (BETA ) service. The idea is to automate the above process and continuously enrich the contents with pertinent correlation searches.
API service simply provides a set of rules/SPL searches, which are continuously updated by our team. With version 2.2.0 of the app we added an optional scheduled search as a setup parameter: MITRE ATT&CK Get Attack Detection Rules.
UPDATE (December 2022): We removed the API service and included all the rules within the app with newer versions starting with version 3.4.0. In addition, most of the Splunk’s out-of-the-box rules come with proper annotations so that we simply updated the app to read those on the fly instead.
Summary
In this part of the series, I wanted to go over the process of creating a new correlation search for MITRE ATT&CK related techniques in order to use with MITRE ATT&CK App for Splunk.
References:
- MITRE ATT&CK
- MITRE Cyber Analytics Repository
- Splunk Enterprise
- Splunk Enterprise Security
- Splunk ES Content Update
- MITRE ATT&CK App for Splunk
- Documentation for MITRE ATT&CK App for Splunk


