Splunk Data Models & CIM
In this post, you will find out what Splunk data models and CIM (Common Information Model) are and why they hold that much importance.
Splunk is a scalable system that uses any machine data (all IT streaming, machine, and historical data, such as Windows event logs, web server logs, live application logs, network feeds, metrics, change monitoring, message queues, archive files) for indexing and searching. These machine data are generated continuously and they are piling up for us to analyze. To make analysis, reports, and dashboards more efficient in terms of time, we need indexable and quickly searchable datasets. At this very moment, data models give us a lift.
CIM is a Splunk Add-on. It is put to use in normalizing different events to a shared structure. This allows us to correlate fields; for instance, we can gather the clientIP and the userIP data under a shared field name. The CIM add-on consists of preconfigured data models, so we can map our data to these data models.
In short, the number of generated event logs increases dramatically. The data size can reach multiple billion events per day for large organizations and unfortunately, they are not coming from the same source. The events are obtained in various formats that do not share a common standard. The bottom line is that we need well-organized data normalization to search faster and examine before getting lost in such a large amount of data.
What is Splunk Data Model?
Data models are hierarchically structured datasets that generate searches and drive Pivots. Data models can give insights about the data and a non-Splunker can use Pivots to make analyze and quickly create graphics, reports, and dashboards out of the dataset with the provided data models. Also, data models are used with CIM to normalize the data to match a common standard.
Each data model represents a category and they can consist of more than one dataset. You can select different indexes to create different categories.
Types of Datasets:
- Event datasets: The root event datasets represent types of events.
- Search datasets: The root search datasets can use any kind of search.
- Transaction datasets: The root transaction dataset allows us to create a dataset from groups of related events that span time. They use an existing object from our data hierarchy to group on. So, they cannot be created directly, you must have an event or a search dataset before creating one.
- Child datasets: Child objects allow us to constrain or narrow down the events in the objects above them in the hierarchical tree.
The main difference between the event and search datasets is the search complexity. You cannot give any pipeline search while defining an event dataset, you can just give conditions. In search datasets, you can create any kind of complex search.

When a dataset is defined with the constraints, Splunk creates the inherited fields by default which are host, source, and sourcetype.
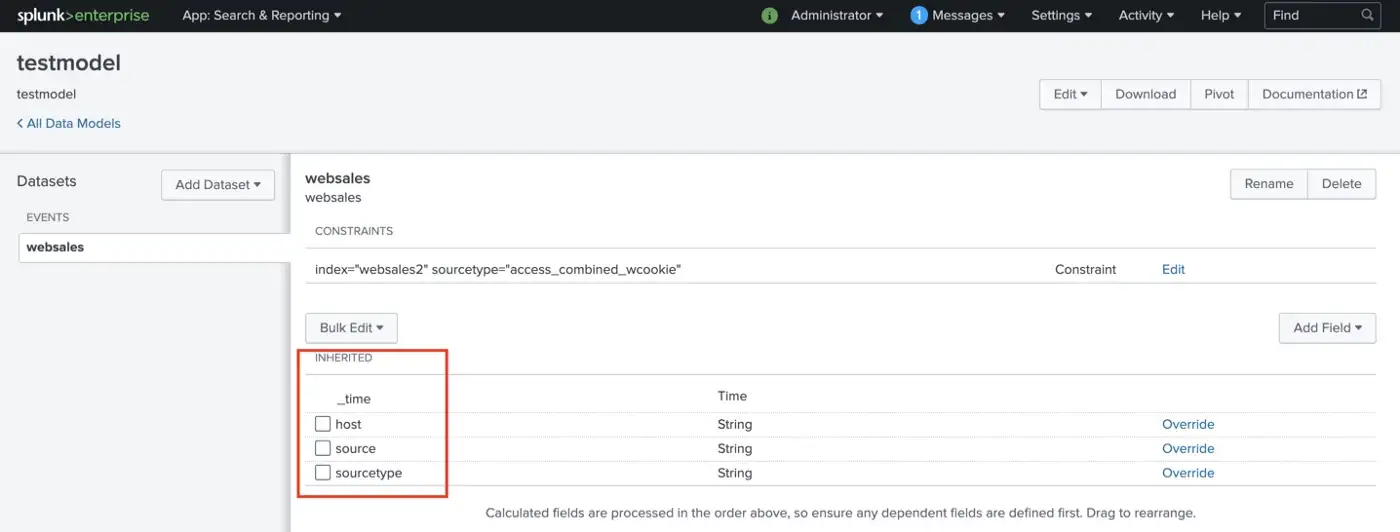
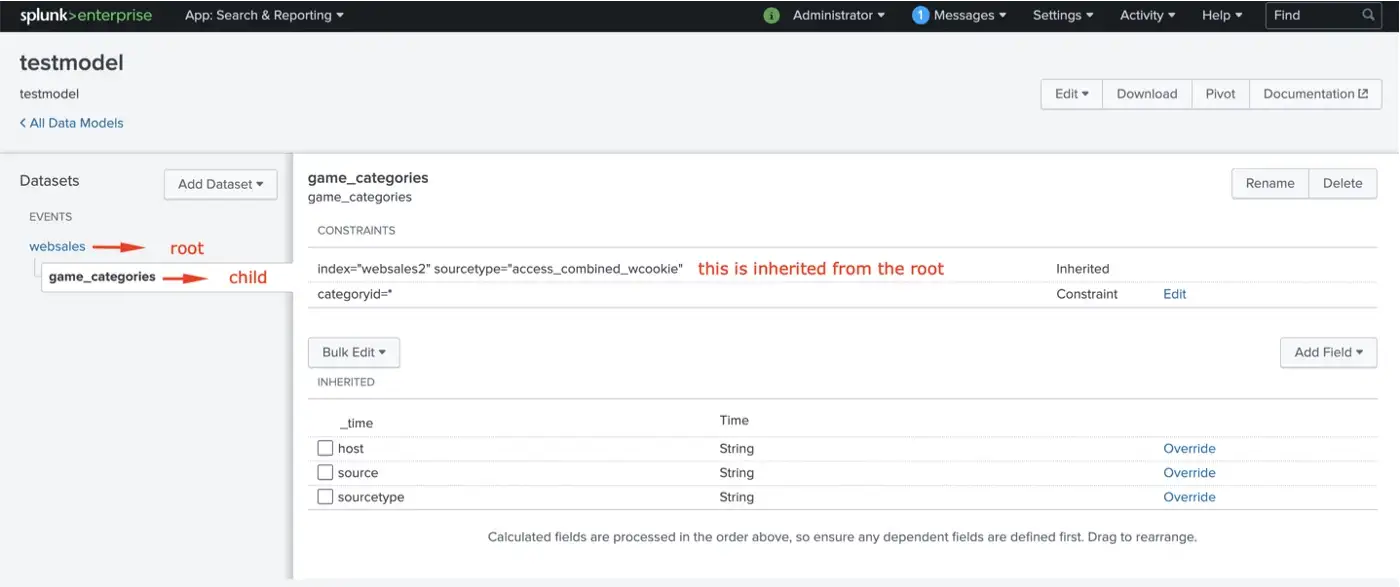
Root datasets have a parental relationship with their child datasets. Actually, these root and child objects are connected with the “AND” boolean operator. Child datasets inherit constraints from the parent and more constraints can be added to the child dataset.
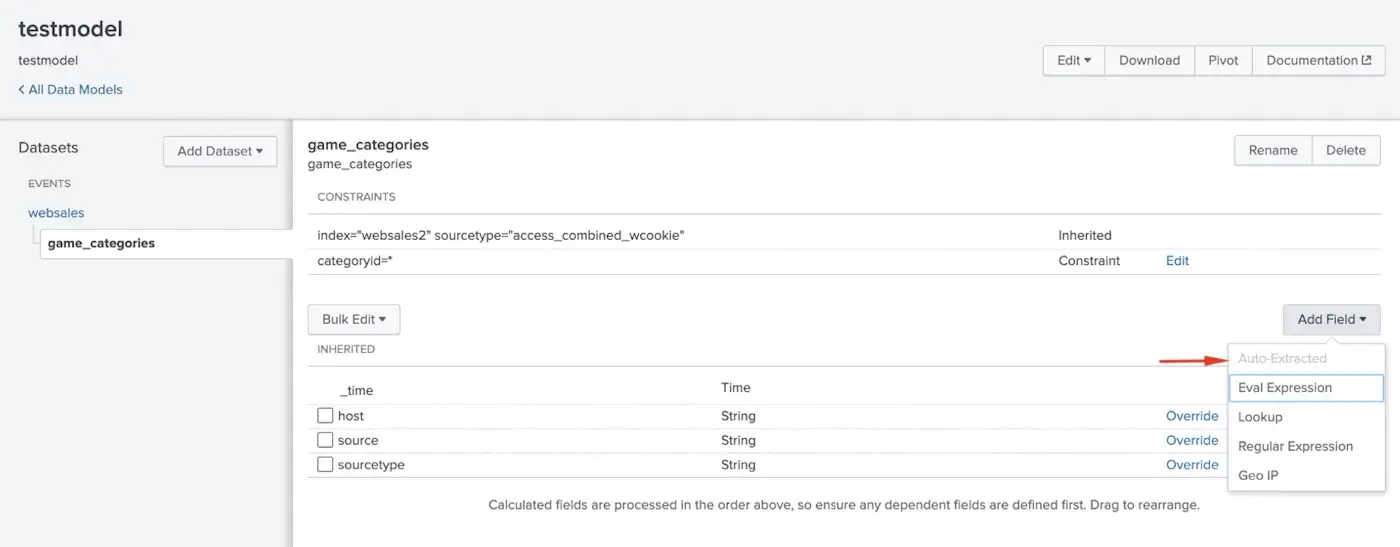
Also, whatever the dataset we want to create, we can add the fields from the add fields dropdown. The rest of the fields will not be in the dataset, hence these fields will not be searchable.
Dataset fields:
- Auto-Extracted: List of fields Splunk extracted from the data. Child datasets cannot add auto-extracted fields since they inherit them from the root.
- Eval Expressions: They are created by running an eval expression on a field.
- Lookup: It is created using a lookup table.
- Regular Expressions: Fields are created using regular expressions.
- Geo IP: It is generated from Geo IP data in the events. Also, it adds fields like latitude, longitude, country, etc.
Splunk Common Information Model
We can ingest nearly any kind of data format to Splunk and these events include a variety of information. These events can be about firewalls, Windows- or Linux-specific data sources, malware activity, database audit logs, etc. Also, they do not share a common naming convention. This is where CIM comes into the scene. For instance, we can match a database or a domain user login activity into the Authentication data model since they consist of the same content.
The CIM uses preconfigured field names, event types, and tags when we want to match the events to a common standard. These events can be from different sources or vendors. After matching the data to a related data model we can create alerts, reports, correlation searches, and dashboards. Of course, we can create searches without using data models. However, if we match the data to a data model, we can directly search data models with the tstats command rather than the stats command for making faster searches. Tstats is faster since it performs queries on indexed fields in .tsidx files. The indexed fields can be provided from normal index data, tscollect data, or accelerated data models. Data model acceleration is a tool that we can use to improve the performance of the queries. Data model acceleration also creates .tsidx files. These files are created for the summary in indexes that contain events that have the fields specified in the data model. tstats command can sort through the full set of .tsidx file summaries that belong to the accelerated data model.
So, how we can match events to a data model? Let me explain this with a real-world example. Assume that you have a tremendous amount of IIS events to analyze. For example, you want to know how many daily unique visitors there are, or you want to monitor the number of requests to see that is there an excessive amount of requests than normal. After ingesting the IIS logs, Splunk performs index-time and/or search-time field extractions according to your Splunk Add-on or your own props and transforms configurations. Also, you can look at Splunk Common Information Model Add-on Manual which tags are required to make your data CIM-compliant. Since we have IIS logs we can match them to the Web data model.
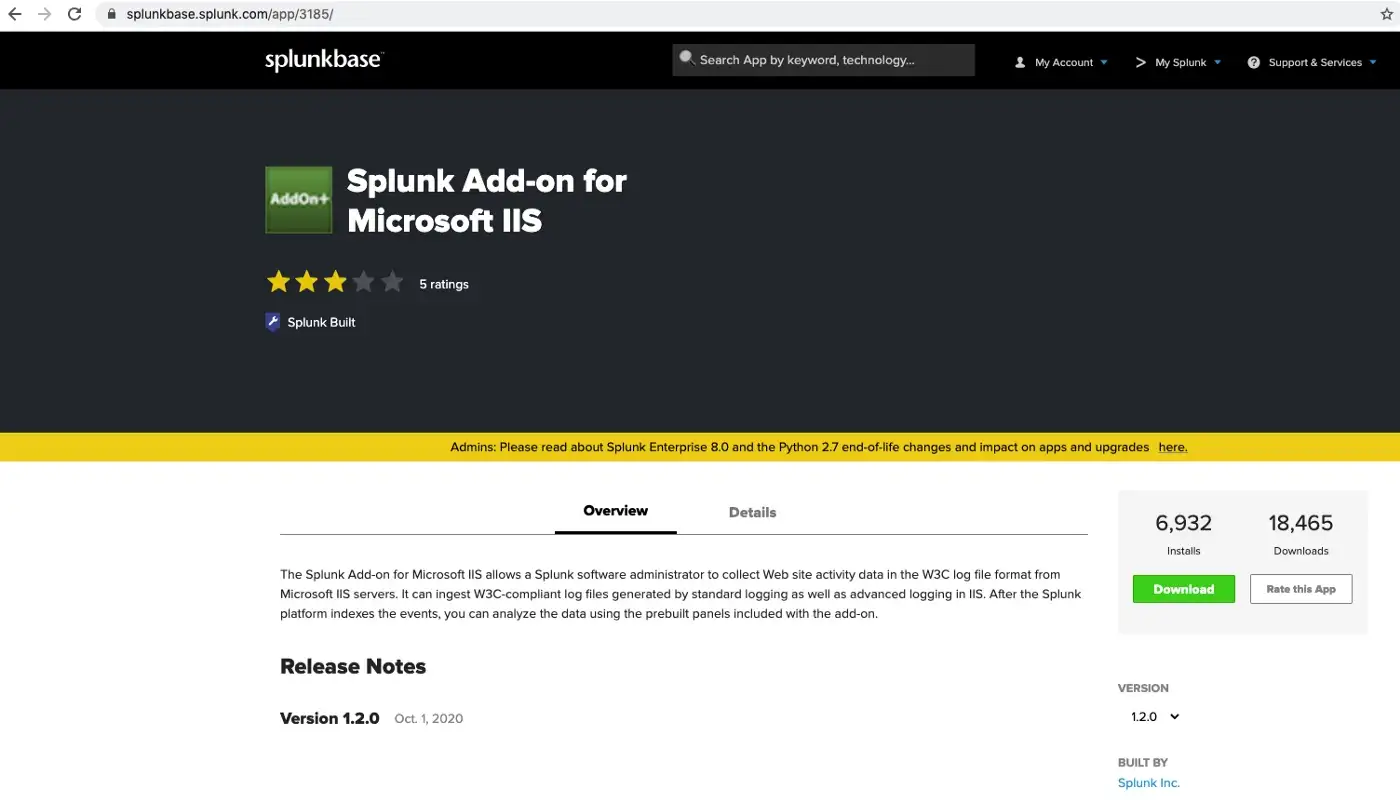
In this case, there already is an Add-on built by Splunk to do field extractions and mapping fields to CIM predefined fields.
As it is seen from the below images, the web data model has an src field. There is a c_ip field in our IIS logs which is the IP address of the client that made the request. The description of the src field represents the c_ip field. By reading the CIM manual you can match your fields with the predefined fields.
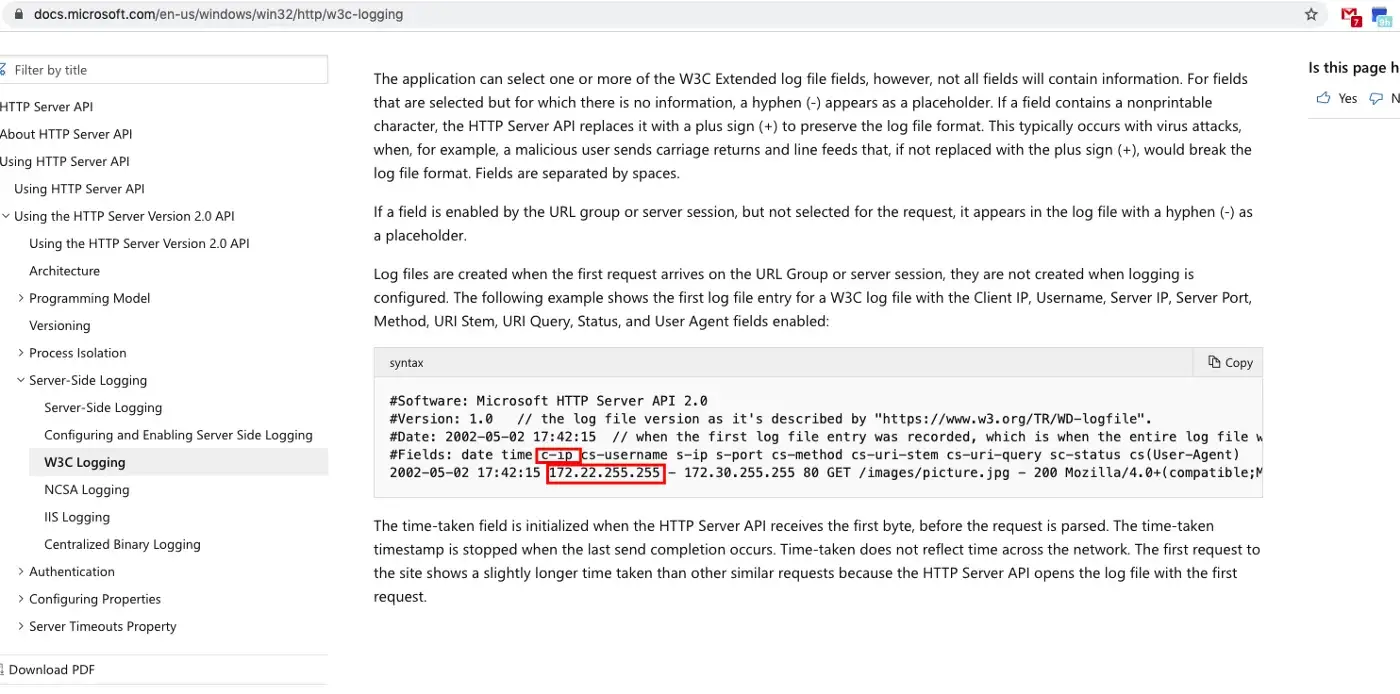
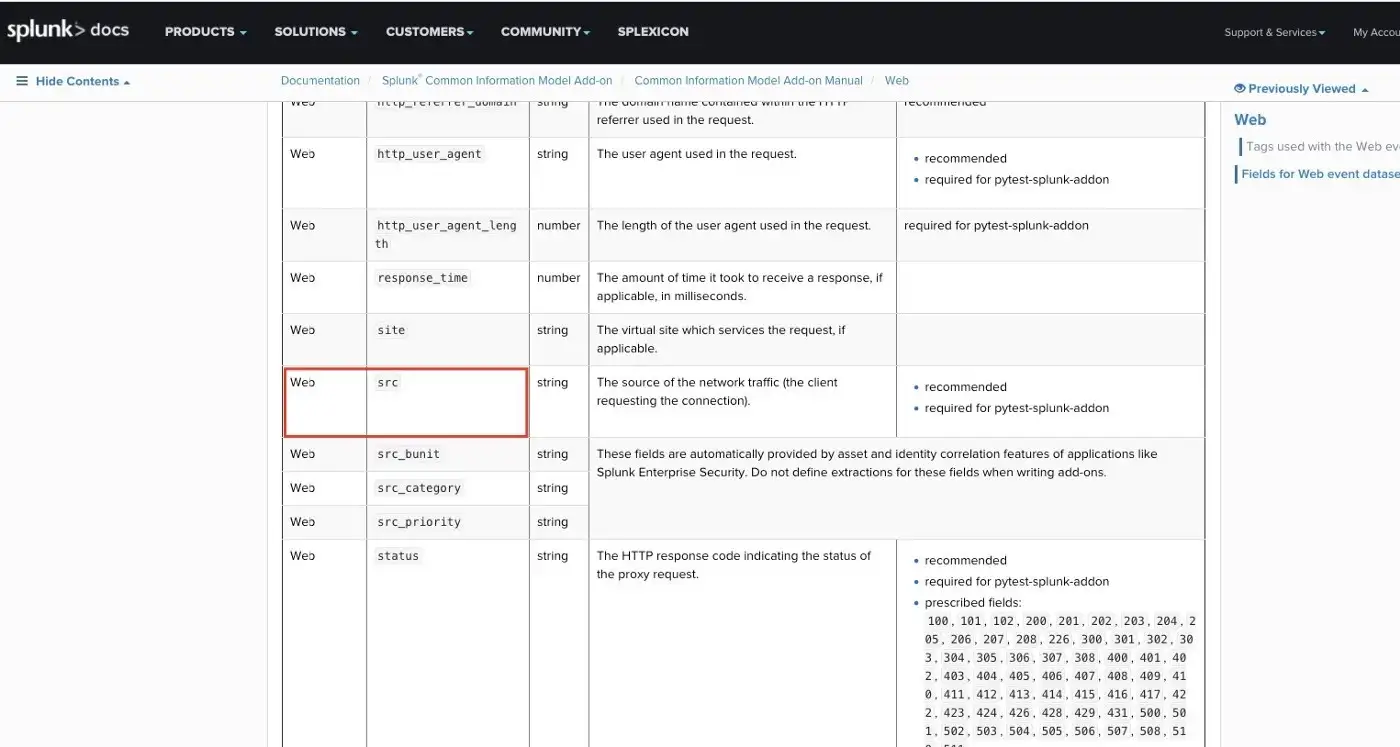
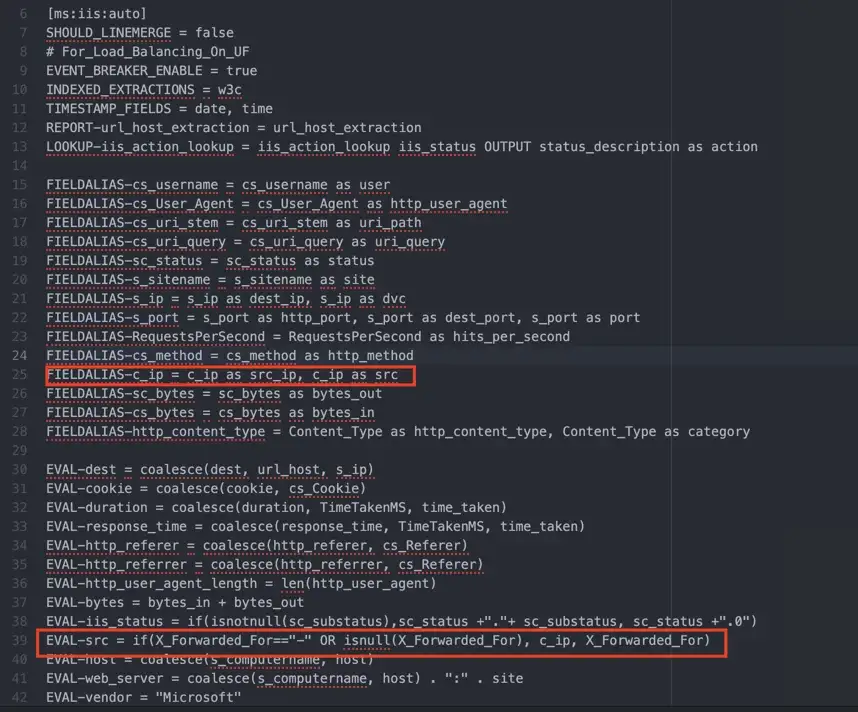
If we say that how this Add-on made this matching, you can look at the props.conf inside of the Add-on. There is a FIELDALIAS setting that creates an alternate name for the c_ip field at search-time. Also, you can create an src field with EVAL if you want to use the X_Forwarded_For field as the src field rather than c_ip.
After matching the fields, we need to create event types and tags. This Add-on also creates the event types and tags in eventtypes.conf and tags.conf as is shown below. If you are wondering about the differences between event types and tags, there is a good explanation here that you can look at.
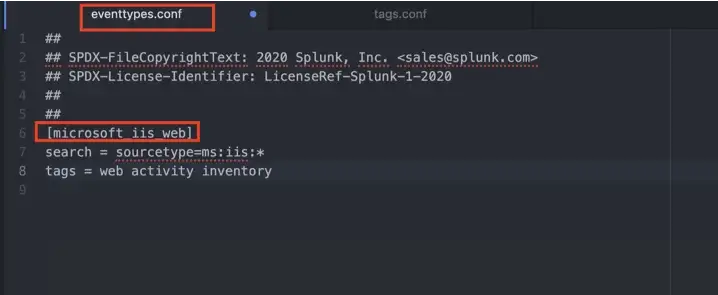
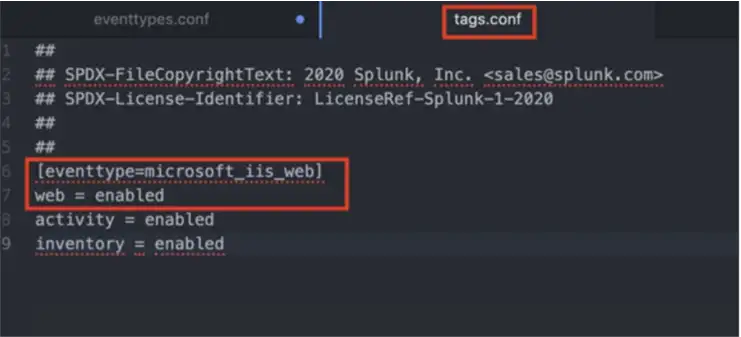
At this point, we matched IIS fields to the Web data model. Now we can search with stats and tstats and compare their run times.
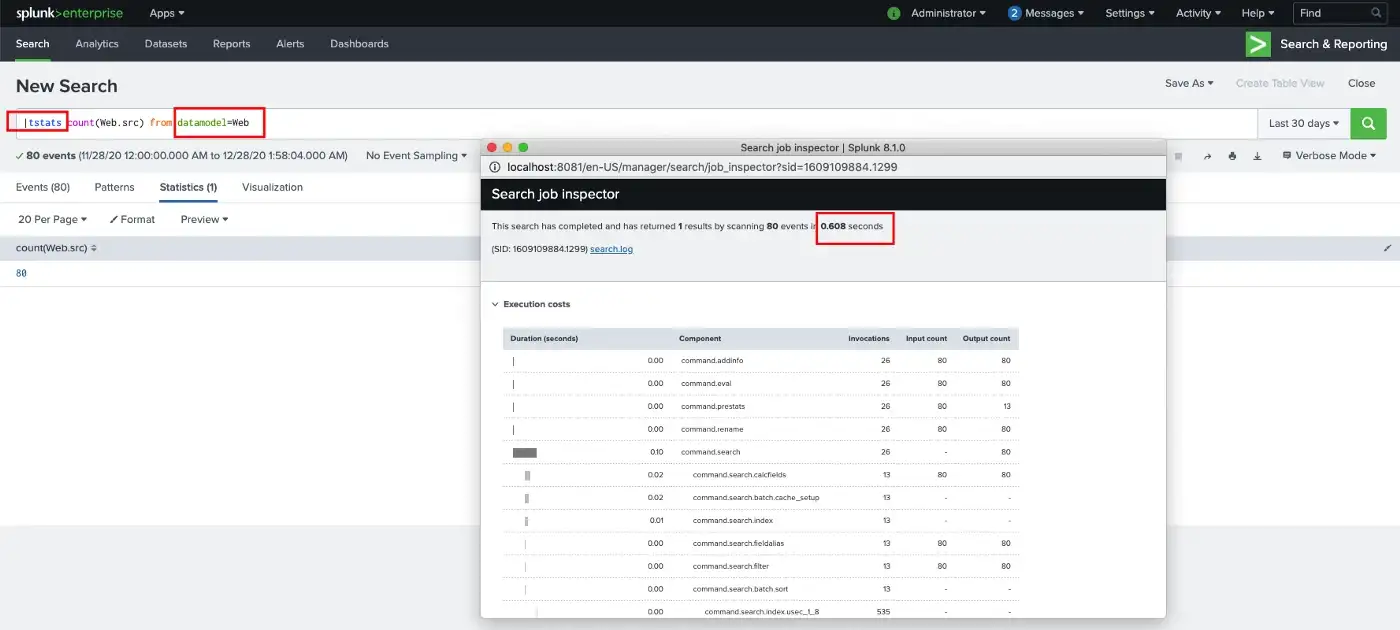
While stats takes 0.849 seconds to complete, tstats completed the search in 0.608 seconds.
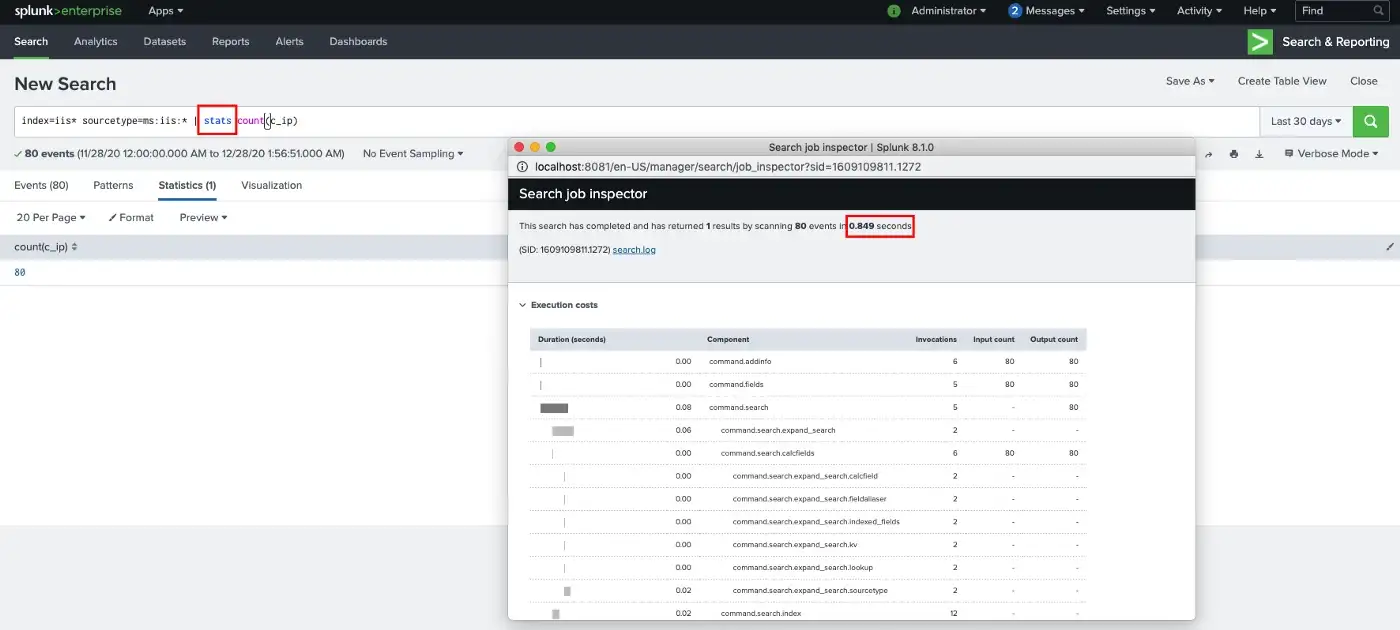
Although I have 80 test events on my iis index, tstats is faster than stats commands. If you think about the number of events and saved searches in a production environment, tstats can be very useful.


