Syslog Data Collection (SC4S) for Splunk and Custom Inputs
As per Splunk Validated Architectures, Splunk Connect for Syslog (SC4S) is the current best practice recommendation to collect syslog data. This article provides instructions on how to configure custom syslog inputs (also how to filter out the data) to be ingested to Splunk.
“Splunk Connect for Syslog (SC4S) is a community project focused on reducing the pain of getting syslog data sources into Splunk. — SC4S”
Splunk Connect for Syslog is based on the syslog-ng, so these filters are actually syslog-ng filters. SC4S provides predefined SC4S log paths for several vendors. If the device you use belongs to one of these vendors, use the predefined log paths to ingest data and filter according to the documentation. For other data sources, custom inputs/log paths can be created.
Before ingesting events, install the Splunk Add-on or a custom one on the search head(s) for the field extractions. If SC4S is exclusively used the addon is not required on the indexer.
Custom Input Configuration
- Define the listening port for the custom input.
cd /opt/sc4s
vi env_file
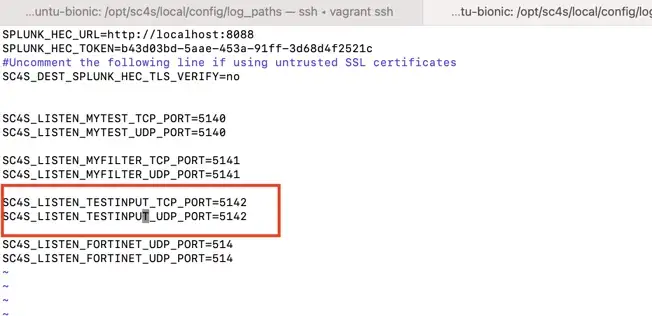
For this example, the listening port is defined as “5142”. The env_file;
- There is an example of a log path provided by SC4S. Copy this example and configure it according to the intended filters and the listening port.
cd /opt/sc4s/local/config/log_paths
cp lp-example.conf.tmpl testinput.conf.tmpl
vi testinput.conf.tmpl
Meet the required environmental variables, such as “SC4S_LISTEN_TESTINPUT_TCP_PORT” and “SC4S_LISTEN_TESTINPUT_TLS_PORT” by changing all the “LOCAL_EXAMPLE” variables to “TESTINPUT” as it is defined in the env_file. Also, change all “local_example” keys to specify the index, sourcetype, or source. Here is the section of the “testinput.conf.tmpl” where the custom input is configured.
filter f_test_filter {
    program(sc4splugin);
};

log {
    junction {
        channel {
        # Listen on the specified dedicated port(s) for  traffic
            source ();
            flags (final);
            };
        channel {
        # Listen on the default port (typically 514) for  traffic
            source (s_DEFAULT);
            filter(f_is_rfc3164);
            filter(f_test_filter);
            flags(final);
        };
    };

# Set a default sourcetype and index, as well as an appropriate value for the field
# "sc4s_vendor_product".  This field is sent as an indexed field to Splunk,
# and is useful for downstream analysis.

    rewrite {
        set("test_filter", value("fields.sc4s_vendor_product"));
        r_set_splunk_dest_default(sourcetype("sc4s:test"));
    };
# using the key "test_filter" find any customized index,source or sourcetype meta values
    parser { p_add_context_splunk(key("test_filter")); };

# using any user-supplied filters, override Splunk metadata based on further hostname
# or CIDR block filters.
    parser (compliance_meta_by_source);

# Prepare the payload for sending to Splunk. This step is done here rather than in the
# destination(s) to ensure that it is performed only once.  If the template value is not overridden,
# the default value (2nd argument) is used.
    rewrite { set("$(template ${.splunk.sc4s_template} $(template t_hdr_msg))" value("MSG")); };
- The key is described as “test_filter”. This key needs to be appended to the splunk_metadata.csv to specify the index. Append this “test_filter,index,testsc4s”.
cd /opt/sc4s/local/context
vi splunk_metadata.csv
- After configuration, to update your changes for the systemd-based runtimes, restart SC4S;
sudo systemctl restart sc4s
After restart “testinput.conf” is created according to the “testinput.conf.tmpl”. Do not change “testinput.conf” if you want to change the custom input.
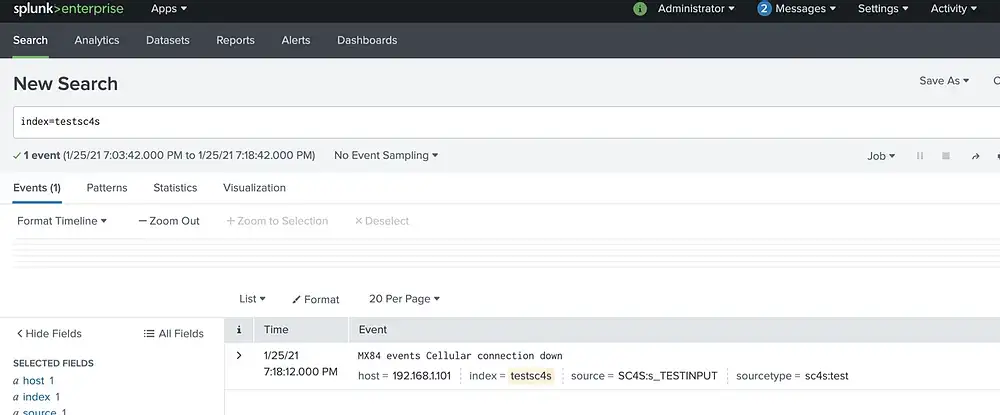
This custom input is listening to port “5142”. Hence, any event that comes to this port will be ingested into “sc4s:test” sourcetype and “testsc4s” index since there is no filter yet.
- Let’s say we are ingesting a connection status of a device. However, the status to be monitored is only “down”. So, filtering these events can be done using regular expression with message() filter function.
filter f_test_filter {
    program(sc4splugin);
};

filter f_filter_down {
    message('down');
};

log {
    junction {
        channel {
        # Listen on the specified dedicated port(s) for  traffic
            source ();
            filter(f_filter_down);
            flags (final);
            };
        channel {
        # Listen on the default port (typically 514) for  traffic
            source (s_DEFAULT);
            filter(f_is_rfc3164);
            filter(f_test_filter);
            flags(final);
        };
    };
- Now the events that contain the “down” word in it will be ingested. Send sample data to port 5142 of SC4S host to test the filter;
echo "Jan 25 16:18:12 192.168.1.101 MX84 events Cellular connection down" > /dev/udp/<SC4S_ip>/5142
echo "Jan 25 16:18:12 192.168.1.101 MX84 events Cellular connection up" > /dev/udp/<SC4S_ip>/5142
- If different types of events are coming from port “5142”, these events can be split into two different sourcetypes.
filter f_test_filter {
    program(sc4splugin);
};

filter f_filter_down {
    message('down');
};

log {
    junction {
        channel {
        # Listen on the specified dedicated port(s) for  traffic
            source ();
            flags (final);
            };
        channel {
        # Listen on the default port (typically 514) for  traffic
            source (s_DEFAULT);
            filter(f_is_rfc3164);
            filter(f_test_filter);
            flags(final);
        };
    };

# Set a default sourcetype and index, as well as an appropriate value for the field
# "sc4s_vendor_product".  This field is sent as an indexed field to Splunk,
# and is useful for downstream analysis.

  if {
    filter(f_filter_down);

    rewrite {
        set("test_filter", value("fields.sc4s_vendor_product"));
        r_set_splunk_dest_default(sourcetype("sc4s:dvc:connection"));
    };
  } else {
    rewrite {
        set("test_filter", value("fields.sc4s_vendor_product"));
        r_set_splunk_dest_default(sourcetype("sc4s:vpn:connection"));
    };
  };
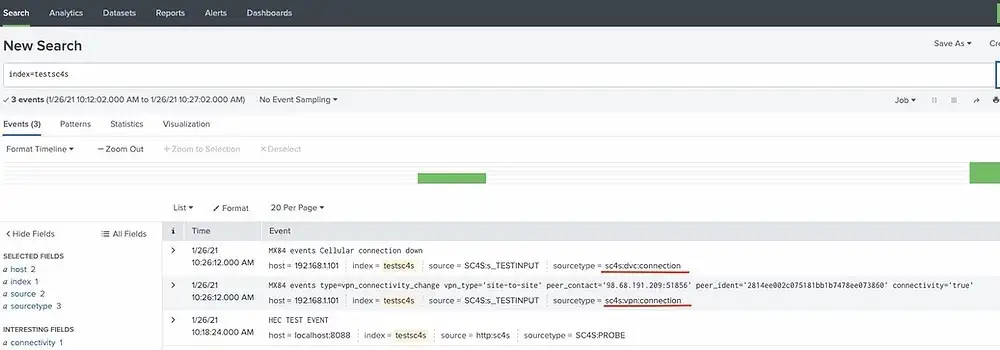
As it is seen, connection status of device and VPN connectivity events are split into two sourcetypes.
echo "Jan 26 07:26:12 192.168.1.101 MX84 events Cellular connection down" > /dev/udp/ <SC4S_ip> / 5142
echo "Jan 26 07:26:12 192.168.1.101 MX84 events type=vpn_connectivity_change vpn_type='site-to-site' peer_contact='98.68.191.209:51856' peer_ident='2814ee002c075181bb1b7478ee073860' connectivity='true'" > /dev/udp/ <SC4S_ip> / 5142
- If you want to filter by hosts, netmask() function can be added as filter.
filter f_filter_host {
    netmask("192.1.1.1/32");
};