Converting Event Logs into Metrics in Splunk
As well as collecting event logs, metrics data can be ingested into Splunk. There are a few ways to ingest metrics data; Splunk has already prepared some technology add-ons for this. But also, event logs can be converted to metrics data while ingesting. Metrics data is stored in a different type of index called metrics index in the Splunk platform. Log-to-metrics conversion is just for you if you have a custom data source that you want to collect and monitor.
In this post, you will find out how to convert event logs to metrics and search them in Splunk.
What are metrics?
Metrics data are a set of data points indicating activity, and they are measured over time. A single metric data point consists of a timestamp, metric_name, numeric_value, measurement, and dimensions.
- timestamp: when the data point is measured
- metric_name: what are you measuring like CPU or disk utilization (size or percentage)
- numeric_value: integer or double float value
- measurement: the combination of metric_name and numeric_value like metric_name:cpu.UsePct=30
- dimensions: provides additional information(metadata) such as hostname, instance name, or location. Each metric data point has three default dimensions(metadata) like in the event logs: host, source, and source type.
The most common metrics examples are infrastructure metrics of databases, containers, and virtual machines or system metrics such as disk, memory, and CPU utilization. In addition to these, metrics data can be collected from IoT devices(temperature, humidity, proximity sensors), application-specific metrics(performance of a function), or Software as a Service (SaaS) systems.
How to collect metrics data?
There are several ways to get in metrics data like StatsD and collectd daemons, CSV files, TCP/UDP, HTTP/HTTPS, and we can convert log data to metrics in Splunk. Splunk’s most popular technology add-ons convert log data to metrics which are Splunk Add-on for Microsoft Windows and Splunk Add-on for Unix and Linux to collect system metrics such as CPU, memory, disk, interface, or process level metrics, etc. These technology add-ons collect log data and convert the log data to metrics while ingesting it as index-time processes.
Benefits of log-to-metrics conversion?
In comparison to events in event indexes, metrics indexes store metric data points in a way that offers better search performance and more effective data storage. Also, log-to-metrics conversion may also have benefits for your license quota.
How to convert log data to metrics?
Log-to-metrics conversion can be set up via Splunk Web or the configuration files. transforms.conf is used to specify the schema while props.conf configures the log-to-metrics settings. Also, you can check the forwarder and indexer version compatibility here according to your data type(structured or unstructured).
For today’s use case, I created a dummy data set for CPU and disk utilization.
2022-08-18 19:55:00 host1 free_disk=99 free_cpu=22
2022-08-18 19:55:00 host2 free_disk=06 free_cpu=11
2022-08-18 19:56:00 host1 free_disk=56 free_cpu=99
2022-08-18 19:56:00 host2 free_disk=78 free_cpu=18
2022-08-18 19:57:00 host1 free_disk=99 free_cpu=22
2022-08-18 19:57:00 host2 free_disk=13 free_cpu=11
2022-08-18 19:58:00 host1 free_disk=56 free_cpu=99
2022-08-18 19:58:00 host2 free_disk=78 free_cpu=18
2022-08-18 19:59:00 host1 free_disk=99 free_cpu=22
2022-08-18 19:59:00 host2 free_disk=13 free_cpu=11
Firstly, we have to extract fields to form the measurement (metric_name:numeric_value), so we need to tell Splunk through props.conf and transforms.conf how to extract the fields. Here is the regular expression for the dummy data.
\d+\-\d+\-\d+\s\d+\:\d+\:\d+\s(\S+)\sfree_disk\=(\d+)\sfree_cpu\=(\d+)
- props.conf
[metrics_test]
TRANSFORMS-fields = field_extraction
METRIC-SCHEMA-TRANSFORMS = metric-schema:extract_test_metrics

TRANSFORMS-new_host = new_host
- transforms.conf
[field_extraction]
REGEX = \d+\-\d+\-\d+\s\d+\:\d+\:\d+\s(\S+)\sfree_disk\=(\d+)\sfree_cpu\=(\d+)
FORMAT = free_disk::$2 free_cpu::$3
WRITE_META = true

[metric-schema:extract_test_metrics]
METRIC-SCHEMA-MEASURES = _ALLNUMS_
METRIC-SCHEMA-BLACKLIST-DIMS = host

[new_host]
DEST_KEY = MetaData:Host
REGEX = \d+\-\d+\-\d+\s\d+\:\d+\:\d+\s(\S+)\sfree_disk\=(\d+)\sfree_cpu\=(\d+)
FORMAT = host::$1
As you can see from the field_extraction stanza in the transforms.conf, free_disk, and free_cpu fields are extracted. WRITE_META attribute automatically writes REGEX to metadata since it is index-time field extraction.
- The first group (\S+): host
- Second group (\d+): free_disk
- Third group (\d+): free_cpu
Secondly, to relate the log-to-metrics schema with custom log data, define the METRIC-SCHEMA-TRANSFORMS attribute in the props.conf and use the METRIC-SCHEMA-MEASURES in the transforms.conf how to identify numeric fields. ALLNUMS setting is used as METRIC-SCHEMA-MEASURES to extract numeric values as measurements.
The METRIC-SCHEMA-BLACKLIST-DIMS and METRIC-SCHEMA-WHITELIST-DIMS settings can be optionally used to filter redundant fields.
Also, the new_host stanza provides a way to overwrite the host metadata.
Searching and analyzing metrics data?
There are several search and statistical commands available specific to metrics data.
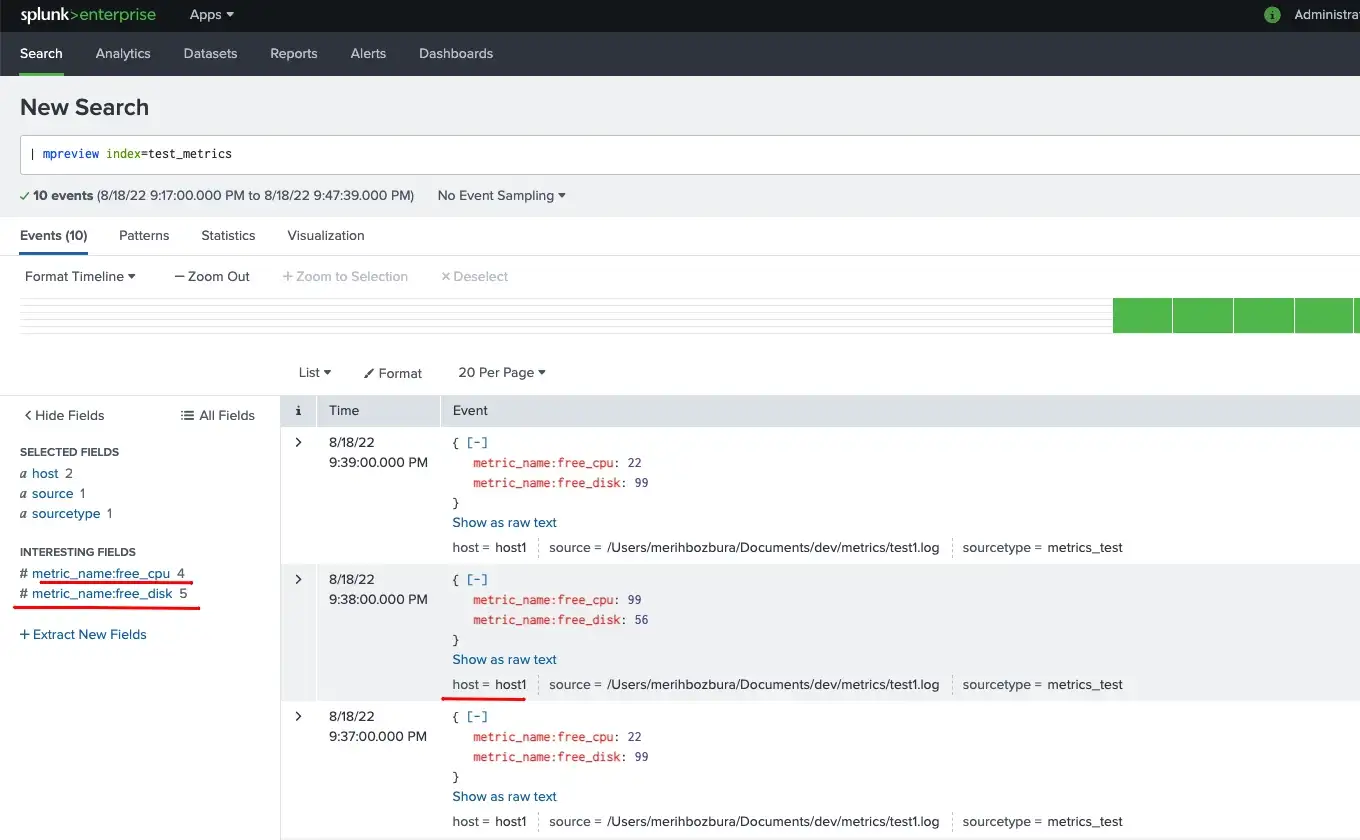
You can use the mpreview search command to review what kind of metrics data you have. You can see the measurements and dimensions with this command.

Also, mstats search command is used to perform statistics on the metrics data, as you can see from the screenshot. It is like the stats command for the events data. So, aggregate and time functions can be used with the mstats command.


In short, you can easily convert the event to metrics and apply several statistics commands to analyze the metrics data in Splunk.
What’s Next?
In this blog, I tried to explain how to convert event logs into metrics data in Splunk. I’ll explain how to integrate with the Splunk IT Essentials Work application for monitoring in the second part.


