Practical Approaches to Tuning ML-Based Correlation Searches in Splunk ES
In a rapidly evolving cyber security environment where new threats are encountered every day, effective threat detection and responses to them depend on advanced correlation research. These searches become exponentially more powerful when paired with machine learning (ML) capabilities. Splunk Machine Learning Toolkit (MLTK) offers powerful tools for improving correlation searches, but optimizing their performance requires a nuanced approach. This product, which operates under certain conditions and limits, may sometimes need practical regulation. This article explores practical strategies for tuning correlation searches using Splunk MLTK. Also, if you want to learn more about Enterprise Security and MLTK you can check official documentation pages.
Below, you will find the use case covered in this blog. Alternatively, you can directly access the provided link. I hope you enjoy reading this article and find it helpful.
Why Correlation Searches?
Correlation searches are designed to identify relationships and to find all patterns between different events and not only the same data source but also different sources. In this way, security teams can detect complex attack patterns and potential security incidents that might otherwise go unnoticed. The integration of machine learning amplifies this capability by enabling the system to learn from data patterns and improve its detection accuracy over time. As the official Splunk ML app, the Splunk Machine Learning Toolkit can be used to create correlation searches and relevant Splunk Search Processing Language (SPL) queries.
Briefly Splunk Machine Learning Toolkit
Different types of algorithm categories such as Anomaly Detection, Classifiers, Clustering Algorithms, Cross-validation, Feature Extraction, Preprocessing, Regressors, Time Series Analysis, and Utility Algorithms come with the MLTK app, as documented. Those familiar with using machine learning methods for calculations understand that the system’s load is directly affected by factors such as the duration of fit and predict periods, the number of groups, data, and variables used. When selecting the method for SPL, the effectiveness of the chosen ML method to calculate the desired outcome is not the primary criterion. Sometimes, this method needs to be simplified to be able to calculate the results.
The Splunk MLTK documentation page mentions some limitations. For example, 1024 is the default group limit of the density function. If your group exceeds this, Splunk will return an error such as “DensityFunction model: The number of groups cannot exceed <abc>; the current number of groups is <xyz>.”, and this error can be found in the mlspl.log file. This limit can be changed in the configuration files, but that’s not the main point I want to highlight. Splunk decided on this limitation to prevent potential server crashes. As previously discussed, ML calculations come with heavy loads, which may overwhelm Splunk. Therefore, changing the default amount can be dangerous if your system fundamentally cannot handle these calculations.
On the other hand, there may be a warning that “Too few training points in some groups will likely result in poor accuracy for those groups.” when fitting the MLTK model. This warning indicates that certain signature types lack sufficient data points for accurate calculation, leading to poor accuracy due to statistical limitations.
In order to address the points mentioned above, I would like to share some relatively simple, practical solutions from our previous work related to Enterprise Security Use-Cases.
Correlation Search : Substantial Increase In Intrusion Events
Original
The correlation search was extracted from the SA-NetworkProtection add-on and is described as “Alerts when a statistically significant increase in a particular intrusion event is observed.”. The SPL of the search can be found below. This search is executed for last 1 hour.
| tstats `summariesonly` count as ids_attacks,values(IDS_Attacks.tag) as tag from datamodel=Intrusion_Detection.IDS_Attacks by IDS_Attacks.signature
| `drop_dm_object_name("IDS_Attacks")`
| `mltk_apply_upper("app:count_by_signature_1h", "high", "ids_attacks")`
Model (MLTK: Network - Event Count By Signature Per Hour - Model Gen) can be seen below, generating a normal distribution with yesterday’s “ids_attacks” values at one-hour intervals. The mltk_apply_upper macro is used in the correlation search to call the model and calculate the upper bound with a 95% confidence interval.
| tstats `summariesonly` count as ids_attacks from datamodel=Intrusion_Detection.IDS_Attacks by _time,IDS_Attacks.signature span=1h
| `drop_dm_object_name("IDS_Attacks")`
| fit DensityFunction ids_attacks by signature partial_fit=true dist=norm into app:count_by_signature_1h
Since correlation and related searches are easily explained, alternative calculations can be mentioned instead of default ones. The outcome of these calculations can vary based on the statistical expertise of the individuals conducting the calculations, the complexity of the data, and how the data changes over time. It is not accurate to assume that the data follows a specific distribution without conducting statistical tests in theorical. Each distribution has its own set of assumptions and tests. In practical terms, especially in fields like cybersecurity, analyzing data can be time-consuming and may delay the triggering of alarms. Experts generally prefer to set a fixed upper/lower bound to find outlier data. However, with rapidly developing technology, this approach is becoming insufficient for many areas. Even the advancement of AI and technology cannot guarantee the detection of outliers at the desired speed, especially in big data, as not everyone has access to high technology yet. Therefore, it would be beneficial for the security of alarms and controls to switch to methods that are not static but do not impose too much load on the system.
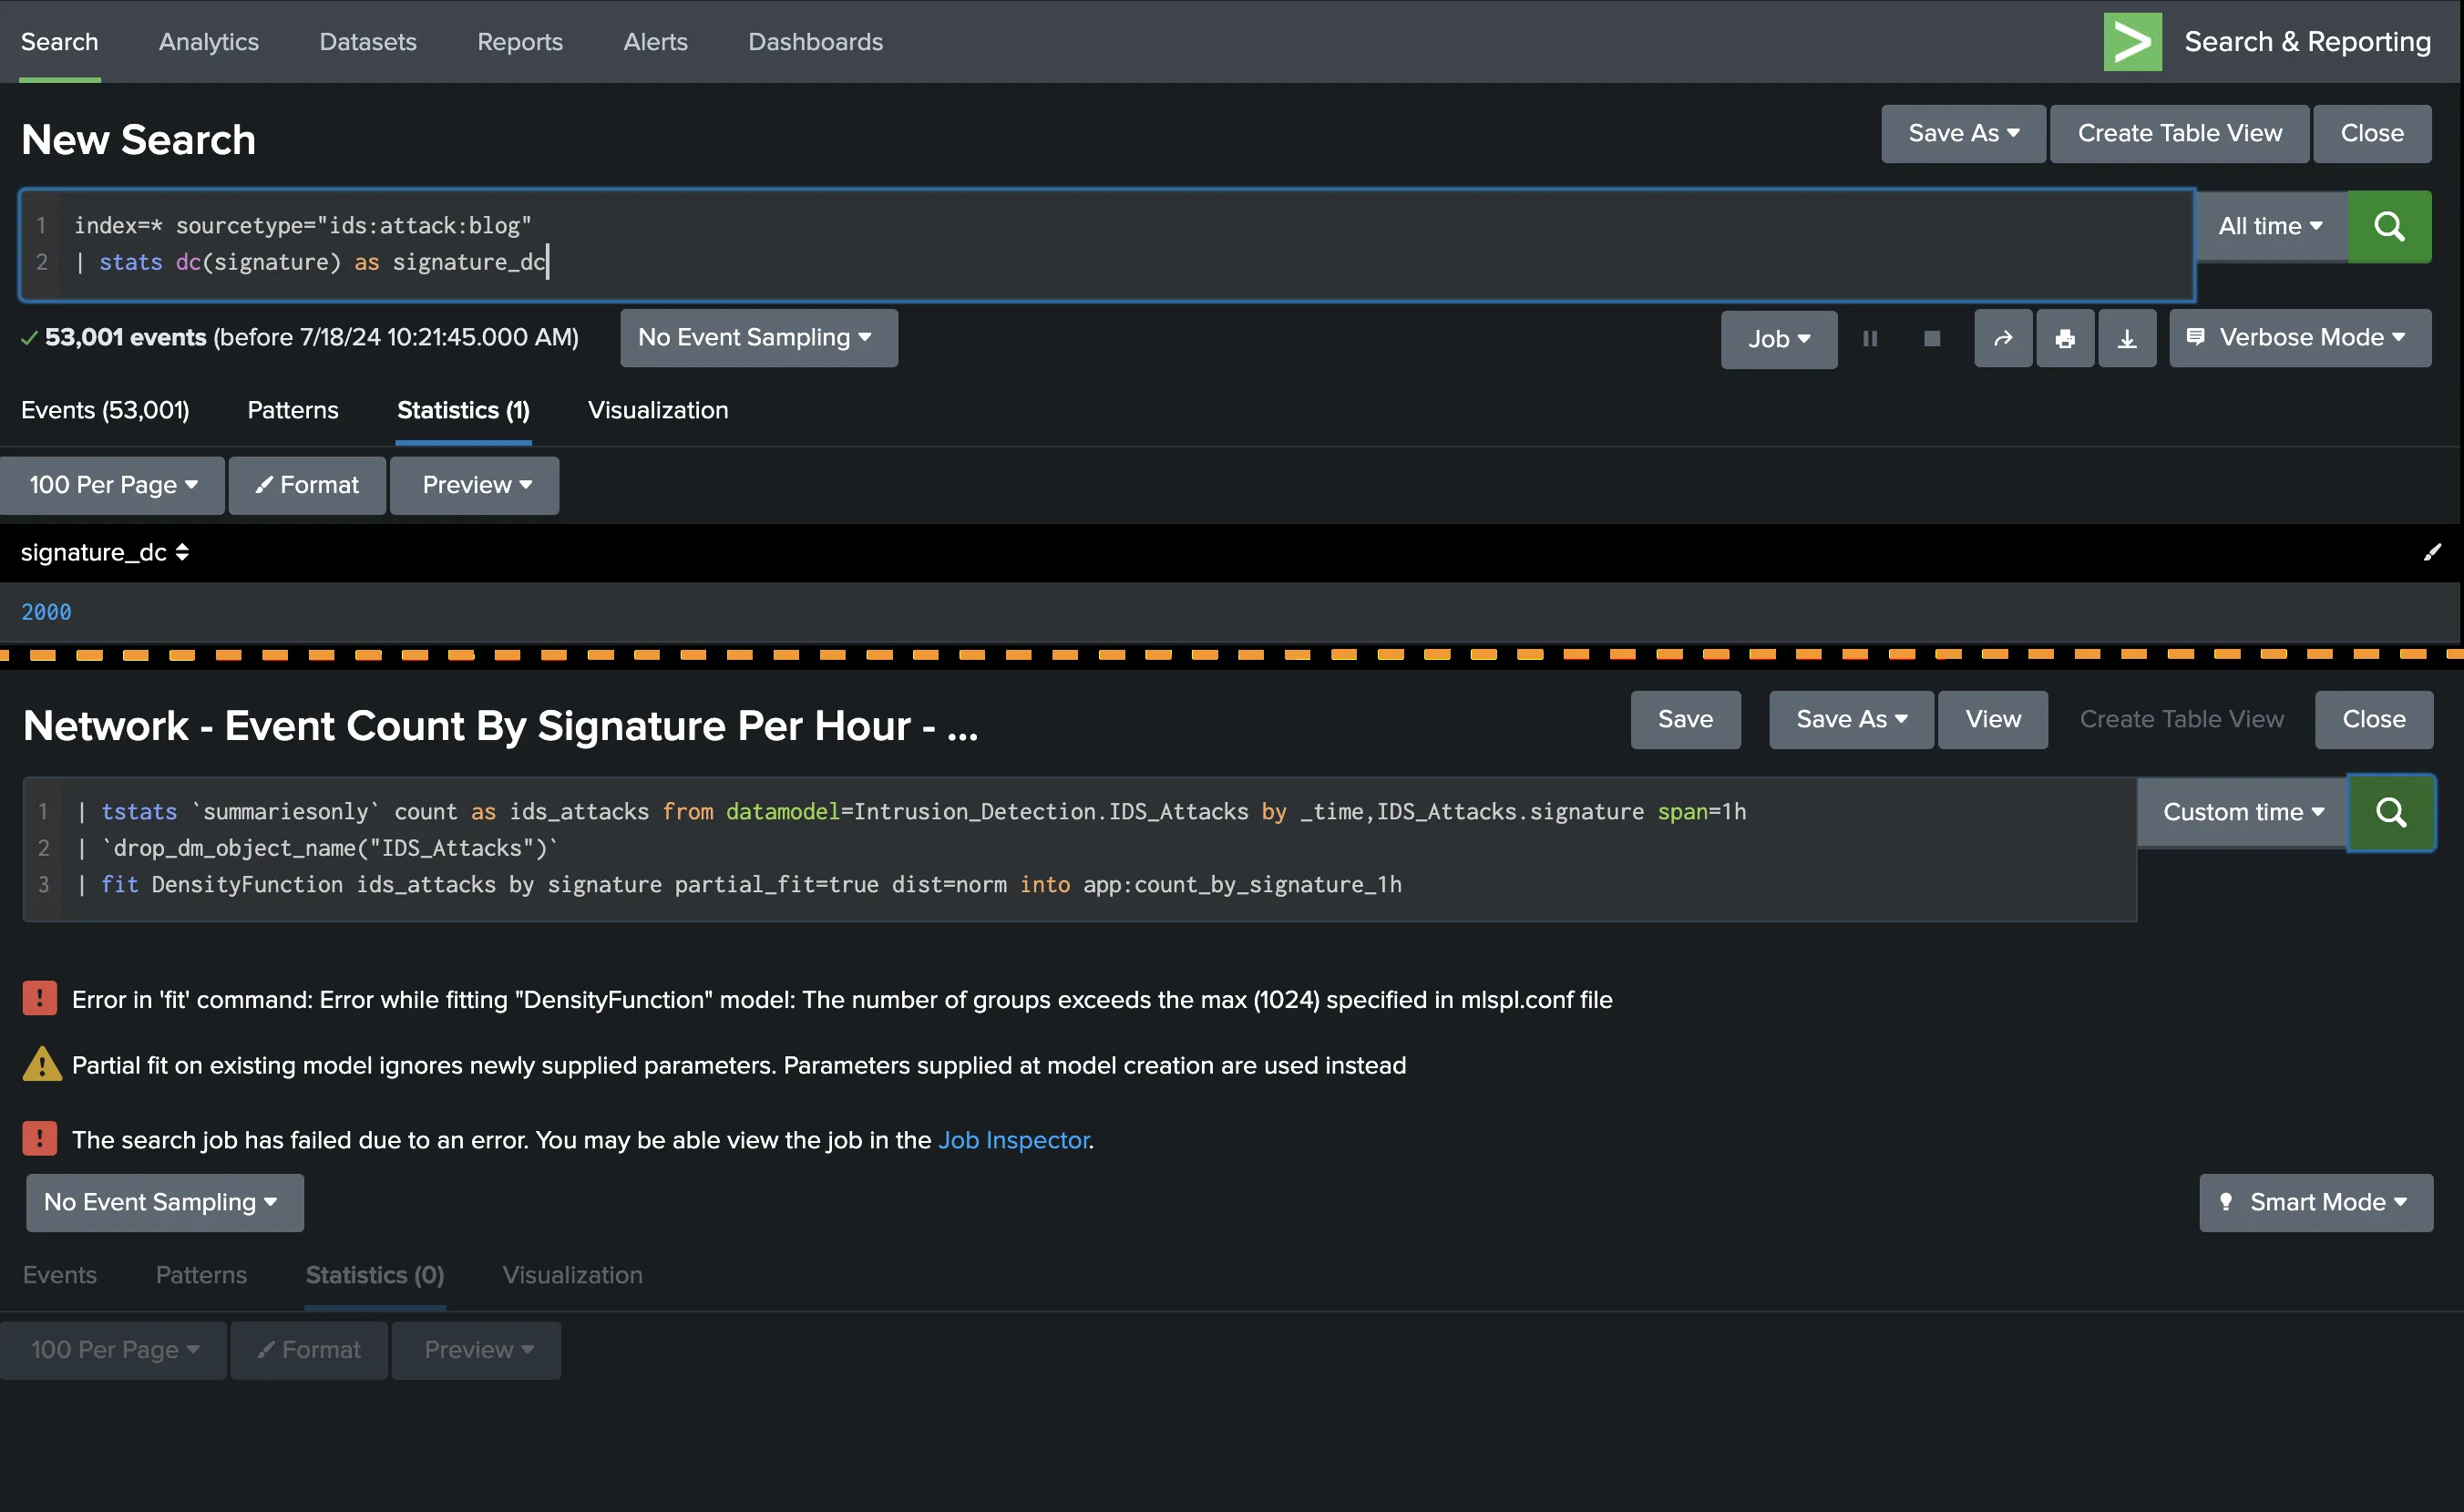
As previously mentioned, under some circumstances, it will not be possible to use correlation searches containing MLTK distribution model calculations directly. Below, you will find correlation and model searches for “Brute Force Access Behavior Detected Over One Day”. Encountered issues when running this correlation search due to more than 1024 signature groups in Splunk, with over 50,000 events and 1024 signature types, in this study (Figure 1).
 |
|---|
| Figure 1: The information about exceeding 1024 signature groups and error images. |
Custom
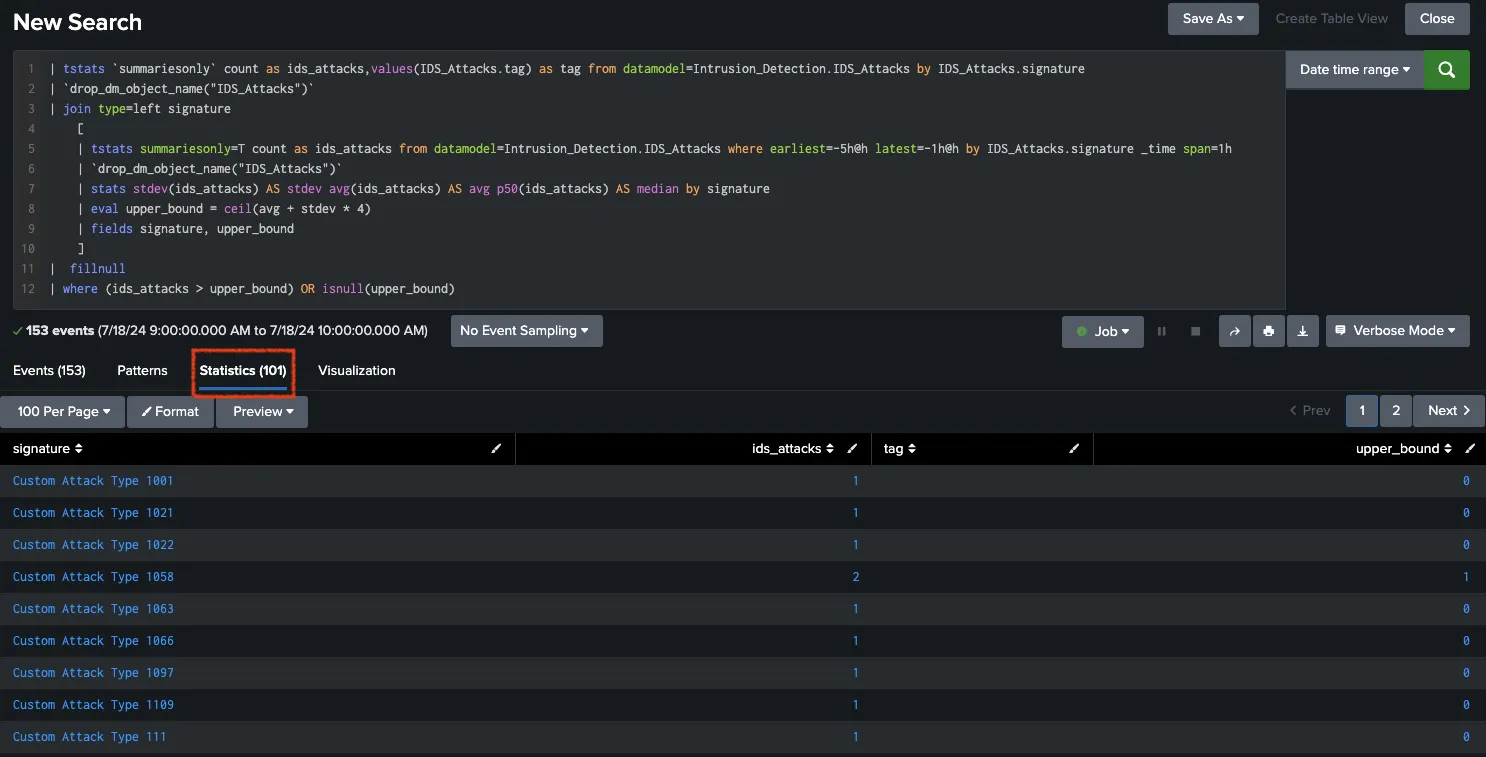
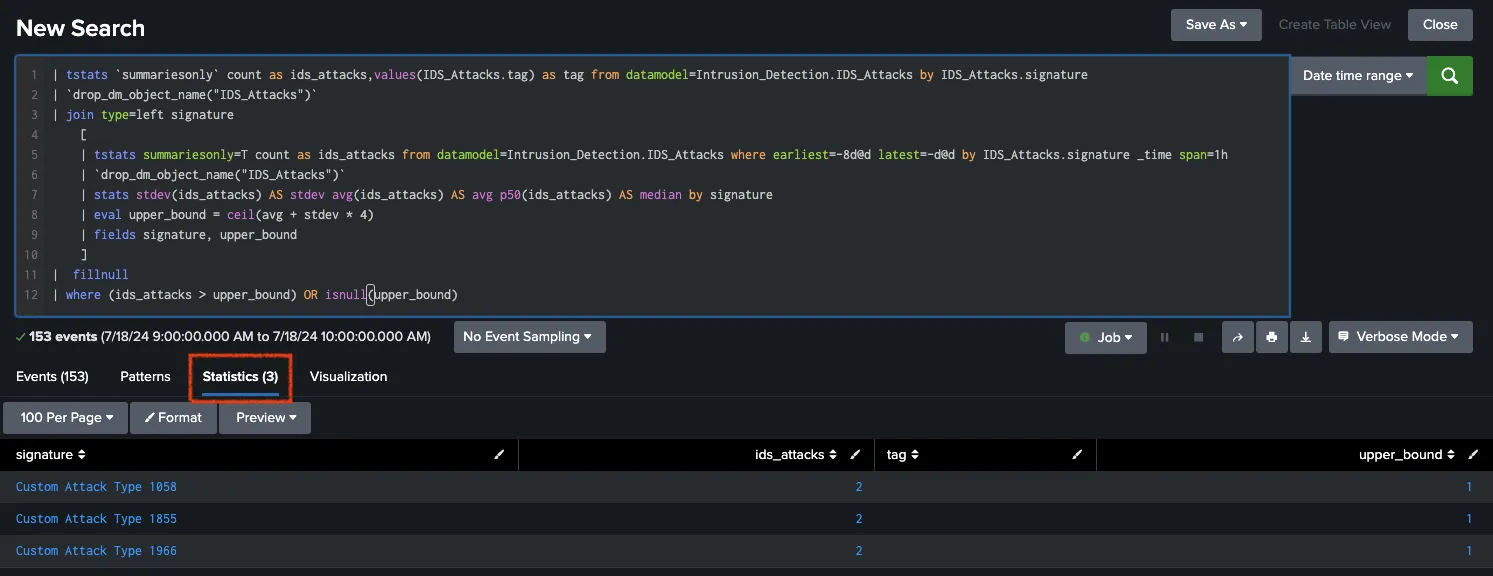
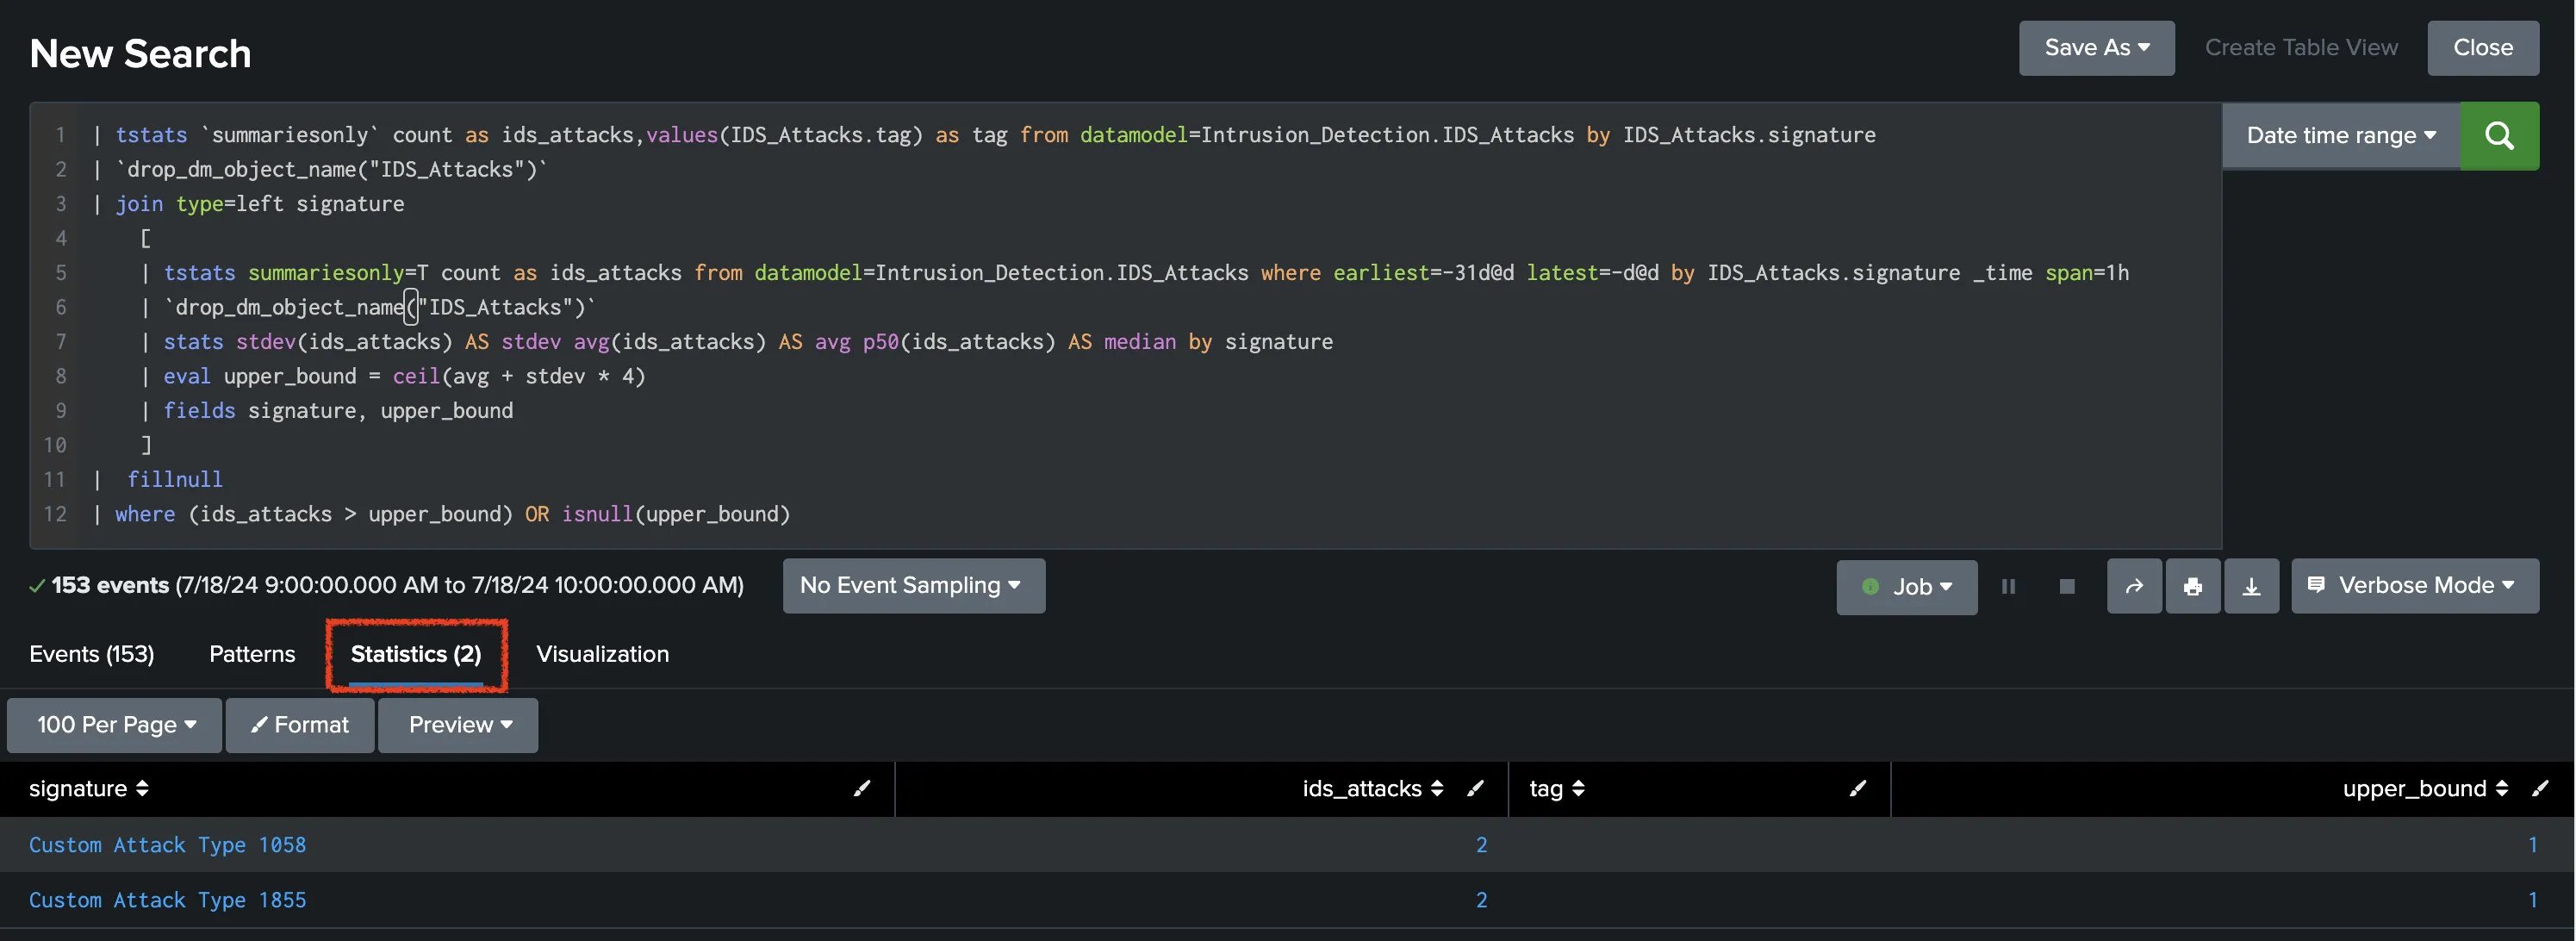
The search was executed with a time filter from 4 hours ago to 1 hour ago, 8 days ago to 1 day ago, and from 31 days ago to 1 day ago with hourly data, resulting in Figure 2 all together as a table. Also, all SPL queries and all results can be found below (Figure 3, Figure 4, Figure 5) individually. There is a slight difference between the upper bound values in both searches. It cannot be said which SPL is way better than the other due to a lack of information about different causes such as the behavioral pattern of the events or the importance of the event’s signatures. For instance, “Custom Attack Type 1001” is counted as 1 in the last 1 hour. All upper bound values are valid, except the one that searches the last 4 hours of data, for which there is no data for that signature in this period. If the last 4 hours filter is selected, this signature will not be seen in this table. Besides, there are different results for 4 hours (101 event counts), 7 days (3 event counts), and 30 days (2 event counts) filters. These differences are the main point that I want to share.
 |
|---|
| Figure 2: Calculating upper bounds for each signature and different time ranges (4 hours, 7 days, 30 days). |
 |
|---|
| Figure 3: Calculating upper bounds for each signature for 4 hours. |
// SPL Query for the filter with 4 hours calculation.

| tstats `summariesonly` count as ids_attacks,values(IDS_Attacks.tag) as tag from datamodel=Intrusion_Detection.IDS_Attacks by IDS_Attacks.signature
| `drop_dm_object_name("IDS_Attacks")`
| join type=left signature
    [
    | tstats summariesonly=T count as ids_attacks from datamodel=Intrusion_Detection.IDS_Attacks where earliest=-5h@h latest=-1h@h by IDS_Attacks.signature _time span=1h
    | `drop_dm_object_name("IDS_Attacks")`
    | stats stdev(ids_attacks) AS stdev avg(ids_attacks) AS avg p50(ids_attacks) AS median by signature
    | eval upper_bound = ceil(avg + stdev * 4)
    | fields signature, upper_bound
    ]
|  fillnull
| where (ids_attacks > upper_bound) OR isnull(upper_bound)
 |
|---|
| Figure 4 Calculating upper bounds for each signature for 7 days. |
// SPL Query for the filter with 7 days calculation.

| tstats `summariesonly` count as ids_attacks,values(IDS_Attacks.tag) as tag from datamodel=Intrusion_Detection.IDS_Attacks by IDS_Attacks.signature
| `drop_dm_object_name("IDS_Attacks")`
| join type=left signature
    [
    | tstats summariesonly=T count as ids_attacks from datamodel=Intrusion_Detection.IDS_Attacks where earliest=-8d@d latest=-1d@d by IDS_Attacks.signature _time span=1h
    | `drop_dm_object_name("IDS_Attacks")`
    | stats stdev(ids_attacks) AS stdev avg(ids_attacks) AS avg p50(ids_attacks) AS median by signature
    | eval upper_bound = ceil(avg + stdev * 4)
    | fields signature, upper_bound
    ]
|  fillnull
| where (ids_attacks > upper_bound) OR isnull(upper_bound)
 |
|---|
| Figure 5: Calculating upper bounds for each signature for 30 days. |
// SPL Query for the filter with 30 days calculation.

| tstats `summariesonly` count as ids_attacks,values(IDS_Attacks.tag) as tag from datamodel=Intrusion_Detection.IDS_Attacks by IDS_Attacks.signature
| `drop_dm_object_name("IDS_Attacks")`
| join type=left signature
    [
    | tstats summariesonly=T count as ids_attacks from datamodel=Intrusion_Detection.IDS_Attacks where earliest=-31d@d latest=-1d@d by IDS_Attacks.signature _time span=1h
    | `drop_dm_object_name("IDS_Attacks")`
    | stats stdev(ids_attacks) AS stdev avg(ids_attacks) AS avg p50(ids_attacks) AS median by signature
    | eval upper_bound = ceil(avg + stdev * 4)
    | fields signature, upper_bound
    ]
|  fillnull
| where (ids_attacks > upper_bound) OR isnull(upper_bound)
There may be different statistical analyses conducted before determining the appropriate SPL query to be used. Various filters may be developed based on event analysis.
Conclusion
The MLTK tool is designed for analyzing data distribution and performing various data analyses for a specified period. If additional configurations are not defined, the MLTK will assume that the specified event has a normal distribution and perform calculations accordingly. However, in cases where quick action is required due to constraints of the MLTK tool, simpler statistical methods may provide better results. Before analysis, it is important to determine the desired methods by analyzing events and, if possible, using methods such as Exploratory Data Analysis (EDA) to examine events in detail and calculate filters for a limited period. After knowing the data, either out-of-the-box rules can be customized or a brand new custom SPL query (suggestion: using tstats and datamodel) can be created for the desired topic. These can improve the performance of both analysts reviewing the alarms and the SPLs run in Splunk. —
References:
- [1] Splunk. (2024). Use Splunk Enterprise Security https://docs.splunk.com/Documentation/ES/7.3.2/User/Overview
- [2] Splunk. (2024). About the Splunk Machine Learning Toolkit https://docs.splunk.com/Documentation/MLApp/5.4.1/User/AboutMLTK
- [3] Splunk. (2024). SPL https://docs.splunk.com/Splexicon:SPL
- [4] Splunk. (2024). Machine Learning Toolkit Troubleshooting in Splunk Enterprise Security https://docs.splunk.com/Documentation/ES/7.3.2/Admin/MLTKtroubleshooting
- [5] Splunk. (2024). Machine Learning Toolkit Searches in Splunk Enterprise Security https://docs.splunk.com/Documentation/ES/7.3.2/Admin/MLTKsearches#SA-NetworkProtection
- [6] IBM. (2024). What is exploratory data analysis (EDA)? https://www.ibm.com/topics/exploratory-data-analysis
- [7] Splunk. (2024). Splunk Machine Learning Toolkit. https://splunkbase.splunk.com/app/2890


