Splunk Cluster Manager Redundancy - Part 1: What it is, why it matters
In distributed Splunk environments, the Cluster Manager (CM) plays a critical role: it coordinates peer nodes, their configuration bundles, and ensures data replication rules are enforced. So… what happens if the Cluster Manager goes down?
If you don’t have a plan, and the Cluster Manager goes down, your Search Peers (Indexers) will continue to work - collecting, indexing, searching - a little more, as Splunk documentation says. Problems start when a peer either wants to roll any of its hot buckets, due to a lack of information about the naming of the next hot bucket, or just goes down, and no one can reach this node. At this moment, the name of the horror film is the Bucket-fixing process. 🥺 Besides, this is one of the most important Splunk processes during normal operations. It cannot be done because there is no Manager Node. Config updates cannot be pushed, and the bucket replication process cannot proceed further (for more information, please refer to the Splunk documentation).
That’s where Cluster Manager Redundancy comes in-it ensures your Splunk environment stays operational even when things go wrong.
What is the Cluster Manager Redundancy?
When you enable cluster manager redundancy in Splunk, you’re essentially preparing a second cluster manager node to take over if the active one becomes unavailable. You can monitor this setup both from the Cluster Manager Web UI and through the command line interface (CLI) commands.
At any given time, only one Cluster Manager is “active”, and only this manager is responsible for: coordinating indexers, pushing configuration bundles, and enforcing replication and search factors.
The standby manager remains in sync, continuously receiving the same configuration, app bundles, and state data, but does not control the cluster unless activated. Additionally, both the manager-apps directories must contain the same apps under both cluster managers to ensure they have the same bundle IDs. If you have older versions, or didn’t change directory location after upgrade, this directory can be master-apps.
Lastly, if the active CM fails (or you want to switch it manually), the standby can be promoted to active with a simple CLI command. The key takeaway is: redundancy doesn’t mean two CMs are running things at the same time. It means one is in charge, and the other is quietly ready to step in whenever needed.
So… At this point, let’s discuss the redundancy methods.
The Cluster Manager Redundancy Methods
There are a few ways to implement cluster manager redundancy in Splunk. You have two options for managing Splunk: you can allow it to take control in auto mode or change its settings whenever you like. “Auto” doesn’t mean it will operate entirely on its own; you’ll need to add some third-party configurations to help Splunk. Next, we will discuss these configurations.
There are several ways to implement redundancy for cluster managers in Splunk. Splunk automatically detects the currently active manager on the Manager Node. However, peers cannot directly understand this; we need to inform them which component is reachable at that moment, either manually or automatically. For more information you can check Splunk documentations.
Let’s explore the two main approaches:
1. Load Balancer Method (with Auto Mode)
This method uses a virtual IP or load balancer in front of at least two Cluster Managers (CMs). Cluster peers are configured to point to the virtual IP or load balancer. If one manager fails, the load balancer redirects traffic to the standby CM (Splunk documentation).
| Pros | Cons |
|---|---|
| Allows for seamless failover. | Requires additional infrastructure, such as a load balancer and virtual IPs. |
| Does not require any manual intervention. | Testing and troubleshooting can be slightly more complex. |
| Ideal for production environments with high availability (HA) expectations. |
2. DNS Configuration (with Manual Mode)
In this method, because we inform Splunk that you don’t need to monitor this process, we should focus on monitoring when and which component is down. We can either manually modify the configurations or write an automation script to handle this process for us automatically. You can refer to this documentation for more information. 😊
| Pros | Cons |
|---|---|
| Easy to set up and test, making it ideal for labs and test environments. | Manual action is required during failover. |
| Does not require additional infrastructure, depending on our management method. | Monitoring & controlling the whole system with little downtime is crucial. |
| If monitoring processes are in place for such situations, controlling the failover process becomes straightforward. |
You can use the command below to change the active Cluster Manager. This will affect all managers, and after that, just change the old manager’s IP with the new one on the DNS tables.
$SPLUNK_HOME/bin/splunk cluster-manager-redundancy -switch-mode active
Also, this command is useful when you want to the check current status:
$SPLUNK_HOME/bin/splunk cluster-manager-redundancy -show-status
Applying It All: An Example of High Availability Architecture for a Cluster Manager
We have explored the advantages and disadvantages of various methods, so let’s apply that knowledge to our architecture.
Imagine we are building a Distributed Clustered Deployment with a multi-site (M2) configuration, as shown in the image below. In this sample design, we have 2 Cluster Managers (CMs) - one of them will be also Monitoring Console, Deployment Server, License Server -, 1 Search Head (SH), a group of Indexers. One of the Cluster Managers is active in Site-1, while the other is in standby mode in Site-2. We use a DNS-based failover mechanism and configure the CMs in **manual mode (manager_switchover_mode = manual*) for full control over failover operations.
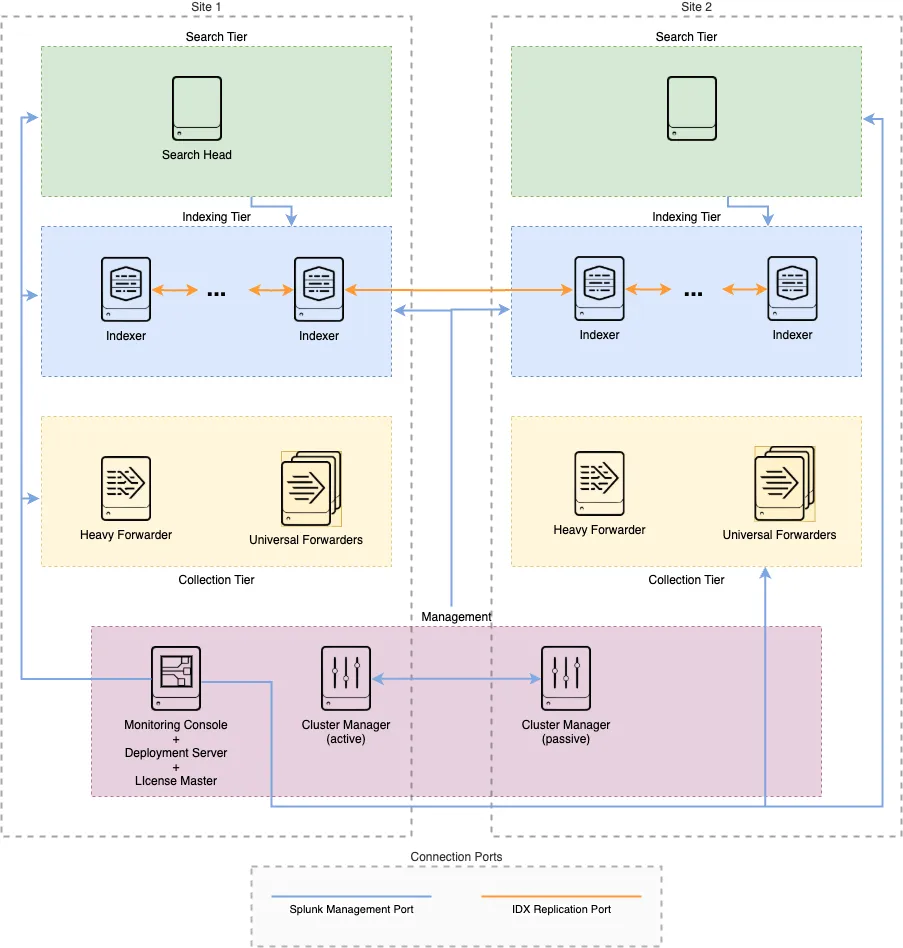 |
|---|
| Figure 1 Example Architecture of the Multi Site Distributed Clustered Deployment. |
According to the server.conf documentation from Splunk:
If set to "auto", an eligible "standby" cluster manager will try to automatically set its redundancy state to "active" upon consecutive loss of [heartbeat](https://medium.com/r?url=https%3A%2F%2Fdocs.splunk.com%2Fobservability%2Fen%2Falerts-detectors-notifications%2Falerts-and-detectors%2Falert-condition-reference%2Fheartbeat-check.html) to the manager which is currently in active state.
This manual control allows us to tailor our failover strategy based on network, environment, and business impact, but also demands a clearly defined operational process when disaster strikes. And when it does, it’s always good to know who’s holding the switch. 😊
In the next blog post, I’ll walk you through the local test environment we set up, based on this architecture. We’ll review the configurations, how the redundancy mechanism behaves in manual mode.
So stay tuned - and get ready to dive into hands-on testing in the next part.
Thanks for reading, and until next time: Happy Splunking! 🚀
References:
- [1] Splunk. (2020). What happens when the manager node goes down https://docs.splunk.com/Documentation/Splunk/9.4.0/Indexer/Whathappenswhenamanagernodegoesdown
- [2] Splunk. (2022). Implement cluster manager redundancy https://docs.splunk.com/Documentation/Splunk/9.4.1/Indexer/CMredundancy#Use_a_load_balancer_to_support_cluster_manager_redundancy
- [3] Splunk. (2021). Splunk Validated Architectures https://www.splunk.com/en_us/pdfs/white-paper/splunk-validated-architectures.pdf
- [4] Splunk. (2025). server.conf https://docs.splunk.com/Documentation/Splunk/latest/Admin/Serverconf#High_availability_clustering_configuration
- [5] Splunk. (2024). Heartbeat Check http://medium.com/r?url=https%3A%2F%2Fdocs.splunk.com%2Fobservability%2Fen%2Falerts-detectors-notifications%2Falerts-and-detectors%2Falert-condition-reference%2Fheartbeat-check.html