Streaming Logs from Kafka to Splunk using the Splunk Sink Connector
We began our journey by streaming logs to Kafka using syslog-ng and rsyslog events to Kafka, then pushed Windows Event Logs from Splunk to Kafka using the Splunk S2S connector.
Now, it’s time to complete the loop: let’s send logs from Kafka into Splunk. In this post, we’ll walk through setting up the Splunk Kafka Sink Connector to stream Fortinet logs from a Kafka topic directly into Splunk via HEC (HTTP Event Collector).
Our goal isn’t just ingestion — we’ll also preprocess the logs to ensure they are properly structured, timestamped, and compatible with the Fortinet FortiGate Add-On for Splunk. This will allow Splunk to parse and extract fields out-of-the-box, enabling better dashboards, alerts, and correlation rules.
Why Send Logs from Kafka to Splunk?
Let’s be honest — not every log belongs in Splunk right away.
In real-world setups, logs often travel through different stages and systems before hitting your SIEM. Whether you’re dealing with chatty firewalls, noisy applications, or verbose audit trails, you might not want to dump everything directly into Splunk.
Instead, you can:
- 🔀 Route logs through syslog relays, agents, or APIs
- 🧱 Use Kafka (or other buffers) to decouple producers from consumers
- 🧹 Preprocess or transform logs to match your internal standards
- 🎯 Forward only meaningful, tagged, and structured events to Splunk
This modularity helps reduce indexing costs, improve search performance, and maintain architectural flexibility. Kafka doesn’t have to be in the pipeline — but if it’s there, it opens up powerful options.
Use Case: Ingesting Fortinet Logs from Kafka into Splunk
Let’s say you already have Fortinet logs (from FortiGate, FortiAnalyzer, FortiManager, etc.) flowing into your Kafka cluster — whether through syslog-ng, or a custom integration.
Now, your goal is to stream these logs from Kafka into Splunk using the Splunk Kafka Sink Connector, but not just as raw data — as enriched, structured, and Splunk-friendly events.
In our example, we’ll:
- 🎯 Simulate Fortinet logs by producing sample events directly into Kafka
- 📥 Pull those logs into Splunk using HEC (HTTP Event Collector)
- 🧾 Retain useful metadata like sourcetype, host, and timestamps
- 🧩 Optionally preprocess the logs with field extractions using props.conf
- 📊 Make the logs usable with the official Fortinet FortiGate Add-On for Splunk
This approach ensures that by the time the events land in Splunk, they’re fully optimized for dashboards, alerts, and searches.
[Fortinet Logs] --> [Kafka Topic (via Producer, Syslog)] --> [Splunk Kafka Sink Connector] --> [Standalone Splunk (via HEC)]
This blog will show a Kafka-based example — but the techniques apply regardless of how logs first enter your pipeline.
⚙️ Step 1: Prepare Splunk HEC for the Use-Case
To receive data from Kafka, Splunk’s HTTP Event Collector (HEC) must be enabled and listening with a valid token.
How you configure it depends on your deployment:
- If you’re on a standalone Search Head or Heavy Forwarder with UI access, you can quickly create the HEC input via the Splunk Web.
- But if you’re sending data to indexers — especially in clustered environments — it’s best to define the input using a custom app.
- In fact, the app method is my go-to method — it’s cleaner, automatable, and better for version control.
Note: If you don’t already have the netops and netfw indexes, please create them first in Splunk.
🔹 Option 1: Create HEC Token via Splunk UI
This is the simplest method — and works well if you’re on a local Splunk setup or an HF with UI access:
1. Go to Settings → Data Inputs → HTTP Event Collector
2. Click “New Token”
3. Name it something like kafka_fortigate_hec_input
4. Choose your target index as netops
5. Set sourcetype to fgt_log (for FortiGate logs)
6. Click Save
💡 Copy and store the token value — you’ll need it when configuring the Kafka Sink Connector.
🔹 Option 2: Deploy HEC Input via a Custom App
This method is ideal when:
- You’re deploying to indexers, especially via a Deployment Server
- You want to version-control your config files
- You need to automate HEC input creation without UI
- You want to just use this method 😊
Here’s how to do it:
🗂 App Structure:
all_hec_inputs/
├── local/
│   ├── app.conf
│   └── inputs.conf
└── metadata/
    └── local.meta
📄 app.conf
[install]
state = enabled

[package]
check_for_updates = false

[ui]
is_visible = false
is_manageable = false
📄 inputs.conf
[http]
disabled = 0

[http://kafka_fortigate_hec_input]
disabled = 0
token = 0b459e53-975f-4e07-b458-1d65d7132ca1
useACK = 0
index = netops
sourcetype = fgt_log
📄 local.meta
[]
access = read : [ * ], write : [ admin ]
export = system
Deploy this app under $SPLUNK_HOME/etc/apps/ on the target instance (targeted event collector server), then restart Splunk. Also, this path may vary for different Splunk servers (e.g., indexers in an indexer cluster).
If you have any questions, you may want to refer to Splunk Architectures and deploying apps and addons.
✅ You now have a working HEC endpoint on https://
:8088, ready to accept events tagged with `sourcetype=fgt_log`.
You can test your HEC token with the command below:
curl -k https://localhost:8088/services/collector -H "Authorization: Splunk <TOKEN>" -d '{"event":"hello"}'
🧪 Step 2: Prepare Sample Events and Index/Sourcetype Routing
Before we create the Kafka connector configuration, let’s simulate a real-world scenario using two Fortinet log samples:
- Traffic Log:
date=2025-09-24 time=07:22:47 devname="OYKU_FW1" devid="FG200FT111111111" eventtime=1757495250150722528 tz="+0300" logid="0000000013" type="traffic" subtype="forward" level="notice" vd="vdom1" srcip=10.1.100.155 srcname="pc1" srcport=40772 srcintf="port12" srcintfrole="undefined" dstip=35.197.51.42 dstname="fortiguard.com" dstport=443 dstintf="port11" dstintfrole="undefined" poluuid="707a0d88-c972-51e7-bbc7-4d421660557b" sessionid=8058 proto=6 action="close" policyid=1 policytype="policy" policymode="learn" service="HTTPS" dstcountry="United States" srccountry="Reserved" trandisp="snat" transip=172.16.200.2 transport=40772 appid=40568 app="HTTPS.BROWSER" appcat="Web.Client" apprisk="medium" duration=2 sentbyte=1850 rcvdbyte=39898 sentpkt=25 rcvdpkt=37 utmaction="allow" countapp=1 devtype="Linux PC" osname="Linux" mastersrcmac="a2:e9:00:ec:40:01" srcmac="a2:e9:00:ec:40:01" srcserver=0 utmref=0-220586 - VPN Event Log
date=2025-09-24 time=07:22:47 devname="OYKU_FW1" devid="FG200FT111111111" eventtime=1757495250150722528 tz="+0300" euid=2 epid=2 dsteuid=2 dstepid=2 logver=704042662 logid=0101039943 type="event" subtype="vpn" level="information" action="ssl-new-con" msg="SSL new connection" logdesc="SSL VPN new connection" user="N/A" remip=X.X.X.X group="N/A" tunnelid=0 tunneltype="ssl" dst_host="N/A" reason="N/A" devid="YYYY" vd="root" dtime="2024-07-24 17:19:52" itime_t=1721855992 devname="LAB"
These are crafted to align with Fortinet’s official field definitions.
🎯 Our Goal
We’ll route these logs into the correct Splunk index and assign the proper sourcetype before any parsing takes place. That way, Splunk_TA_fortinet_fortigate knows how to handle them automatically.
The routing logic also mirrors what Splunk_TA_fortinet_fortigate app and SC4S suggest. Here’s a simplified mapping table:
sourcetype           index
------------------   ---------
fgt_log              netops
fortigate_event      netops
fortigate_traffic    netfw
fortigate_utm        netfw
fortigate_anomaly    netfw
To automatically assign index and sourcetype based on raw log content, we created a lightweight helper app: my_fortinet_props. When combined with Splunk_TA_fortinet_fortigate, this ensures logs are routed to the appropriate index and sourcetype before parsing. The default option will be index = netops sourcetype = fgt_log.
🗂 App Structure:
my_fortinet_props/
├── local/
│   ├── app.conf
│   ├── props.conf
│   └── transforms.conf
└── metadata/
    └── local.meta
📄 app.conf
[install]
state = enabled

[package]
check_for_updates = false

[ui]
is_visible = false
is_manageable = false
📄 props.conf
[fgt_log]
SHOULD_LINEMERGE = false
TIME_PREFIX = eventtime=
TIME_FORMAT = %s%3N
MAX_TIMESTAMP_LOOKAHEAD = 300
KV_MODE = auto
EVENT_BREAKER_ENABLE = true

TRANSFORMS-force_index_fortigate_netfw = force_index_fortigate_netfw
📄 transforms.conf
# Set index based on log type
[force_index_fortigate_netfw]
SOURCE_KEY = _raw
DEST_KEY = _MetaData:Index
REGEX = ^.+?devid=\"?F(?:G|W|\dK).+?(?:\s|\,|\,\s)type=\"?(traffic|utm|anomaly)
FORMAT = netfw
📄 local.meta
[]
access = read : [ * ], write : [ admin ]
export = system
🚀 App Deployment
- Deploy the
my_fortinet_propsapp to all servers responsible for parsing — this could be indexers, standalone Splunk instances, or heavy forwarders. In our example, this will be a standalone Splunk. - Also install the official Splunk_TA_fortinet_fortigate to ensure proper field extraction and dashboard availability.
- Restart Splunk to apply changes.
✅ With these in place, your logs will now be routed to the correct indexes and sourcetypes before ingestion — clean, structured, and ready for search.
Next up: ➡️ Create the Connector Configuration to ingest Fortinet logs from Kafka into Splunk HEC.
🔌 Step 3: Install the Kafka → Splunk Connector
In my previous posts:
- We set up Kafka with KRaft mode and custom configuration
- We showed how to stream Windows Events from Splunk to Kafka via S2S
Now it’s time to complete the reverse flow — from Kafka to Splunk. But first, let’s get the connector in place.
📦 Installing the Splunk Kafka Sink Connector
There are two easy ways to get the connector JAR:
➤ Option 1: Via Confluent Hub
➤ Option 2: Via splunkbase. This sends you to splunk/kafka-connect-splunk GitHub page.
Once downloaded, move the JAR file (e.g. splunk-kafka-connect-v2.2.4.jar) into your Kafka Connect $CONFLUENT_HOME/plugins OR which path do you prefer to use. Note that, you must refer your jar file location in your connector properties (in plugin.path).
⚙️ Kafka & Connect Setup Recap
We’re running Kafka in KRaft mode, with this simplified listener setup:
listeners=PLAINTEXT://:9092,CONTROLLER://:9093
Now, let’s spin up Kafka Connect (distributed mode) using the following connect-distributed-quickstart.properties config:
# Kafka bootstrap servers
bootstrap.servers=localhost:9092

# Key/value converter
key.converter=org.apache.kafka.connect.storage.StringConverter
value.converter=org.apache.kafka.connect.storage.StringConverter
key.converter.schemas.enable=false
value.converter.schemas.enable=false

# Internal converters
internal.key.converter=org.apache.kafka.connect.json.JsonConverter
internal.value.converter=org.apache.kafka.connect.json.JsonConverter
internal.key.converter.schemas.enable=false
internal.value.converter.schemas.enable=false

# Plugin path
plugin.path=connectors/,/Users/oyku/dev/confluent/plugins/splunk

# Connect-specific metadata topics
group.id=kafka-connect-splunk-hec-sink
config.storage.topic=__kafka-connect-splunk-task-configs
config.storage.replication.factor=1

offset.storage.topic=__kafka-connect-splunk-offsets
offset.storage.replication.factor=1
offset.storage.partitions=1

status.storage.topic=__kafka-connect-splunk-statuses
status.storage.replication.factor=1
status.storage.partitions=1

# REST settings
rest.host.name=localhost
rest.advertised.host.name=localhost
Once everything is in place:
- ✅ Start Kafka
- ✅ Start Kafka Connect (with the above config)
- 🚀 Move to Step 4: Create the Connector Config to begin sending logs to Splunk!
🧩 Step 4: Create the Connector Config
We’ve already set up Splunk HEC, verified that Kafka is running, and prepared our Fortinet log samples. Now it’s time to bridge the gap — by telling Kafka how to deliver those logs into Splunk.
We’ll do that by defining a connector configuration file named splunk-forti-sink-connector.json.
💾 Why save it to a file? It makes reusability easier. If you need to restart or reconfigure the connector, you won’t need to retype your JSON payload — just update and re-POST it.
🧠 A Note on the Kafka Topic
In this blog, we’ll read Fortinet events from a Kafka topic named fortigate_logs.
If it doesn’t exist yet, create it with:
$CONFLUENT_HOME/bin/kafka-topics --bootstrap-server localhost:9092 --create --topic fortigate_logs --partitions 1 --replication-factor 1
📝 Save the Following to splunk-forti-sink-connector.json:
💾 Please remember that, since this is a test use case, we will not use SSL for the HEC token. Therefore, in the configurations, we should include the parameter
{"splunk.hec.ssl.validate.certs": "false"};otherwise, it should be set to true.
{
  "name": "splunk-sink-connector",
  "config": {
    "connector.class": "com.splunk.kafka.connect.SplunkSinkConnector",
    "tasks.max": "1",
    "topics": "fortigate_logs",
    "splunk.hec.token": "e8de380e-9a31-4p85-b416-9451cbf8as34",
    "splunk.hec.uri": "https://127.0.0.1:8088",
    "splunk.hec.ssl.validate.certs": "false",
    "splunk.index": "netops",
    "splunk.sourcetype": "fgt_log",
    "splunk.hec.raw" : "true",
    "key.converter": "org.apache.kafka.connect.storage.StringConverter",
    "value.converter": "org.apache.kafka.connect.storage.StringConverter",
    "value.converter.schemas.enable": "false"
  }
}
🎯 This config assumes you’re using raw HEC input and forwarding logs to the topic named
fortigate_logs.
🚀 Launch the Connector
curl -X POST -H "Content-Type: application/json" --data @splunk-forti-sink-connector.json http://localhost:8083/connectors
Then check the status:
curl http://localhost:8083/connectors/splunk-forti-sink-connector/status | jq
✅ If everything is correct, you’ll see the connector status as “RUNNING”.
🧯 Troubleshooting Tip
If the connector fails to start, one of the most common reasons is:
- ❌ Invalid or unreachable HEC URI
- ❌ Incorrect or expired HEC token
💡 Don’t worry — Kafka Connect will print a detailed error message to its logs. You can tail it via:
tail -f /path/to/connect/logs/connect.log
Once it’s running, you can start producing logs to the fortigate_logs topic and watch them flow into Splunk! Up next:
➡️ Step 5: Produce and Verify Sample Logs
📤 Step 5: Produce Sample Data
Now that your connector is running, it’s time to push some logs into Kafka and verify they arrive in Splunk — parsed, routed, and timestamped correctly.
🧪 Produce Events to Kafka
Run the following command to open the producer console for the fortigate_logs topic:
bin/kafka-console-producer --broker-list localhost:9092 --topic fortigate_logs
Then paste these two events:
date=2025-09-24 time=07:22:47 devname="OYKU_FW1" devid="FG200FT111111111" eventtime=1757495250150722528 tz="+0300" logid="0000000013" type="traffic" subtype="forward" level="notice" vd="vdom1" srcip=10.1.100.155 srcname="pc1" srcport=40772 srcintf="port12" srcintfrole="undefined" dstip=35.197.51.42 dstname="fortiguard.com" dstport=443 dstintf="port11" dstintfrole="undefined" poluuid="707a0d88-c972-51e7-bbc7-4d421660557b" sessionid=8058 proto=6 action="close" policyid=1 policytype="policy" policymode="learn" service="HTTPS" dstcountry="United States" srccountry="Reserved" trandisp="snat" transip=172.16.200.2 transport=40772 appid=40568 app="HTTPS.BROWSER" appcat="Web.Client" apprisk="medium" duration=2 sentbyte=1850 rcvdbyte=39898 sentpkt=25 rcvdpkt=37 utmaction="allow" countapp=1 devtype="Linux PC" osname="Linux" mastersrcmac="a2:e9:00:ec:40:01" srcmac="a2:e9:00:ec:40:01" srcserver=0 utmref=0-220586
date=2025-09-24 time=07:22:47 devname="OYKU_FW1" devid="FG200FT111111111" eventtime=1757495250150722528 tz="+0300" euid=2 epid=2 dsteuid=2 dstepid=2 logver=704042662 logid=0101039943 type="event" subtype="vpn" level="information" action="ssl-new-con" msg="SSL new connection" logdesc="SSL VPN new connection" user="N/A" remip=X.X.X.X group="N/A" tunnelid=0 tunneltype="ssl" dst_host="N/A" reason="N/A" devid="YYYY" vd="root" dtime="2024-07-24 17:19:52" itime_t=1721855992 devname="LAB"
Once submitted, Kafka Connect will forward them via HEC to Splunk.
🔍 Verify in Splunk
Go to Splunk and search:
index IN (netops, netfw) sourcetype IN (fortigate_event, fortigate_traffic)
If your routing setup in my_fortinet_props and parsing from Splunk_TA_fortinet_fortigate are working correctly, you should see both logs parsed cleanly with the correct:
- index
- sourcetype
- eventtime as the _time field
- KV pairs extracted for CIM DMs (e.g. src, dest, user, tag, etc.)
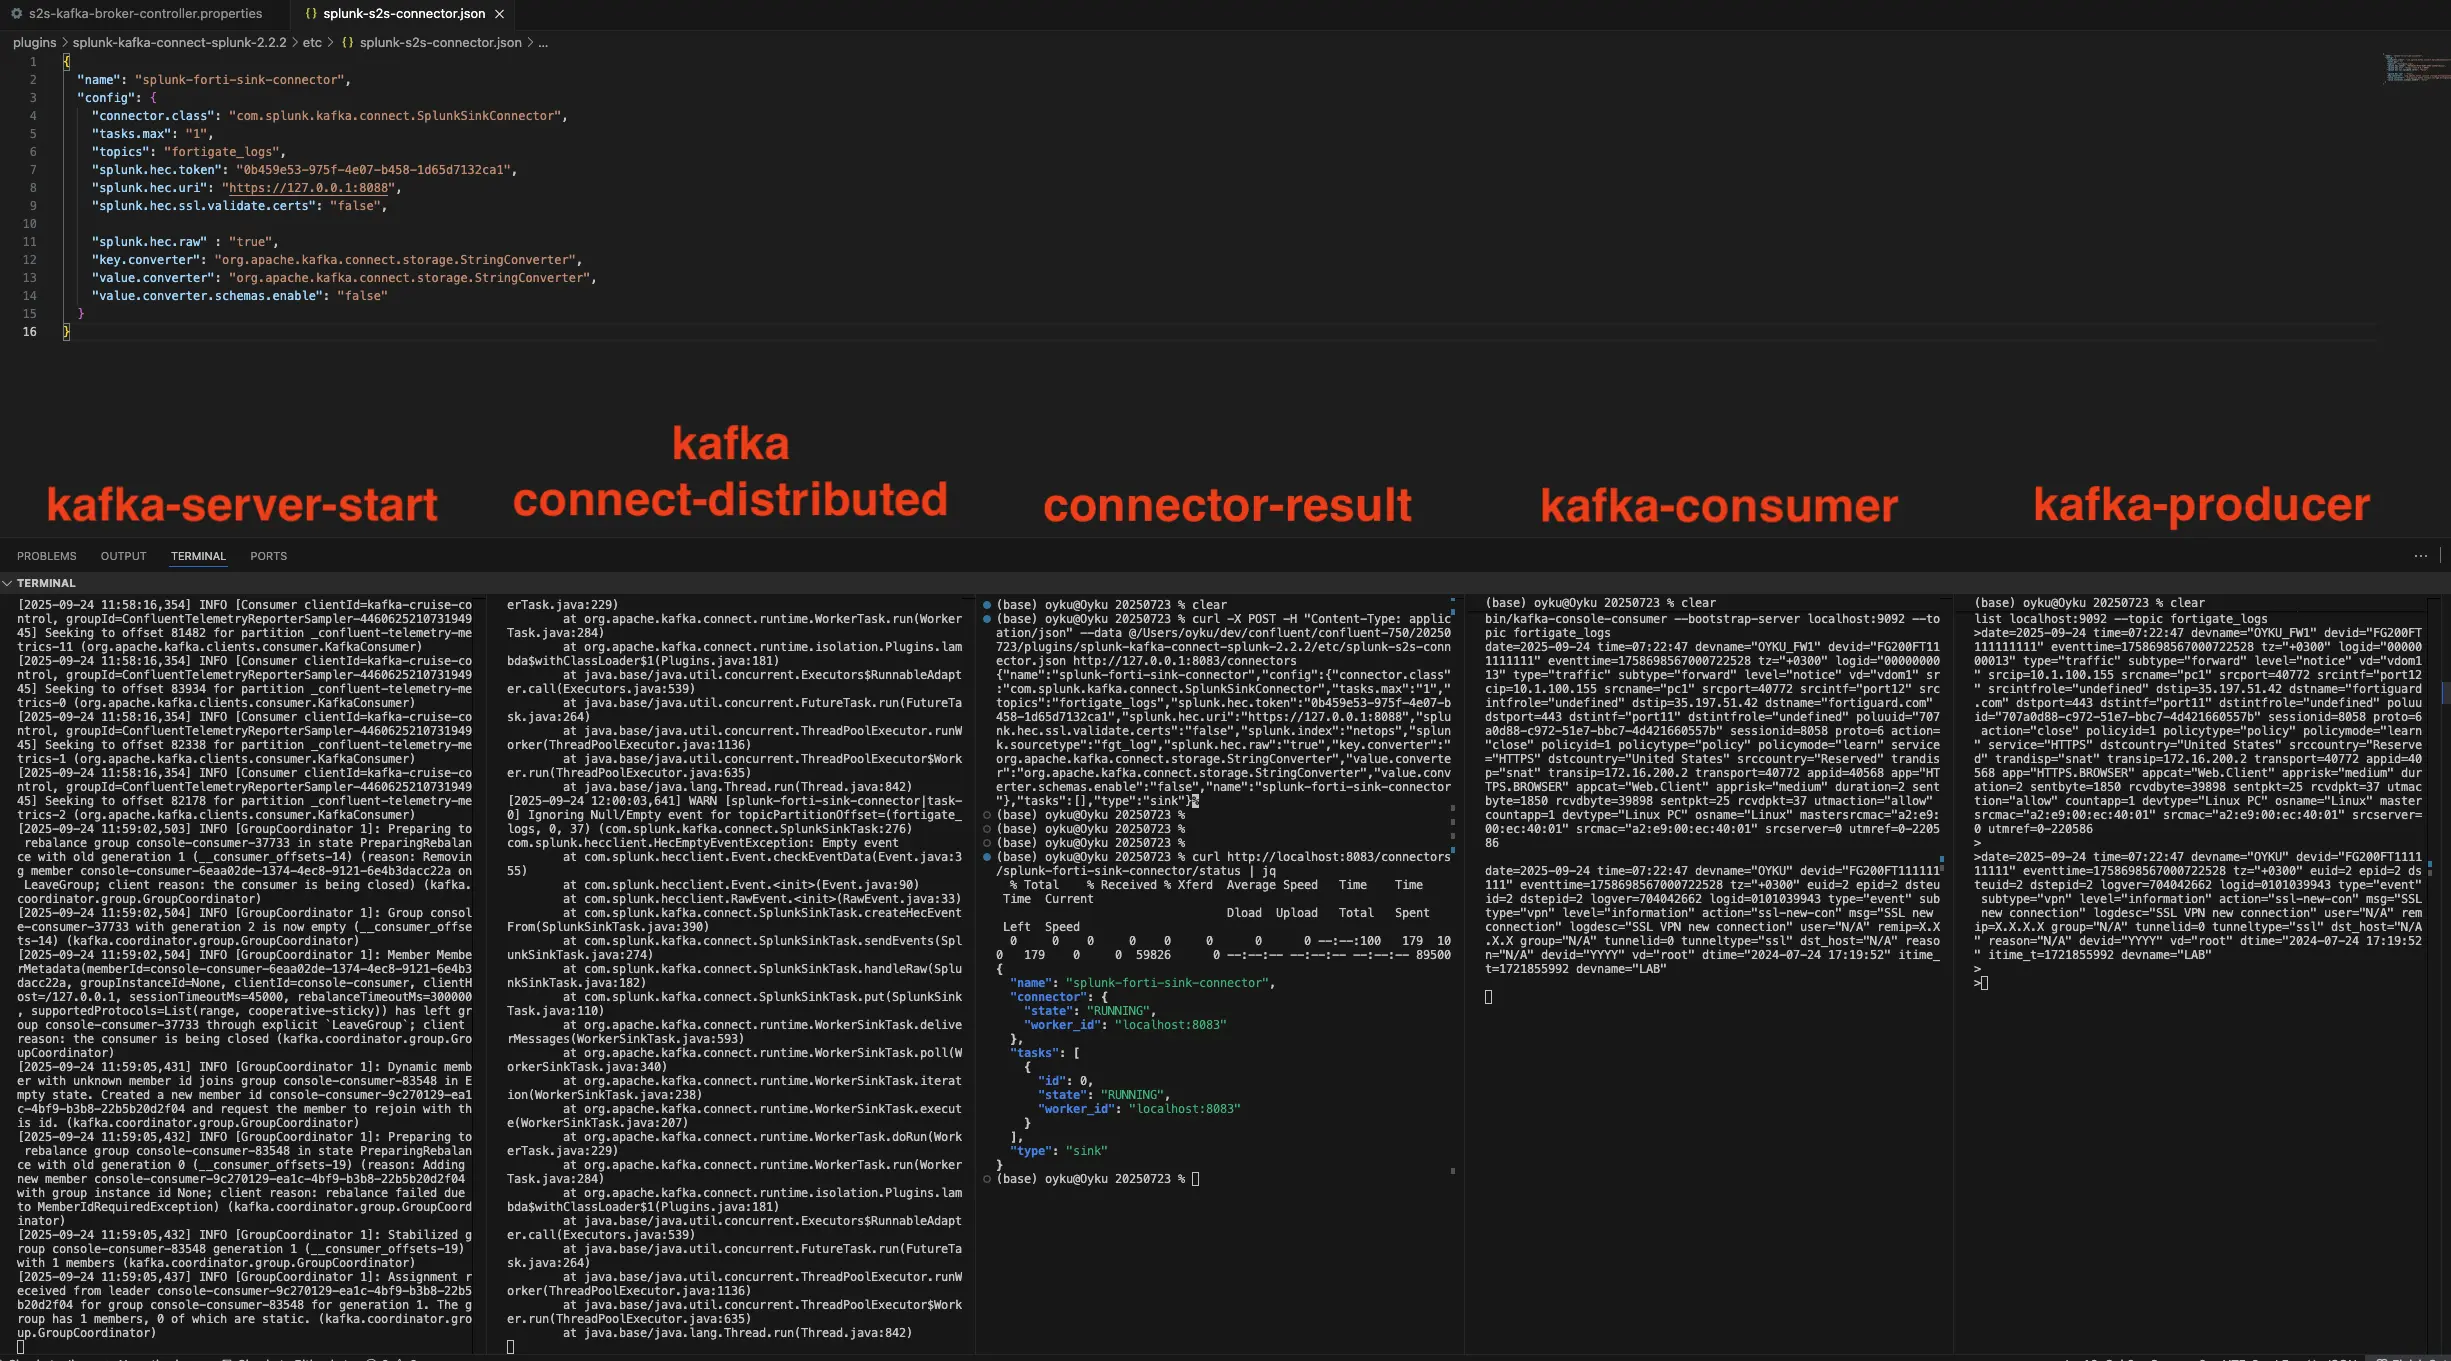 |
|---|
| Figure 1 Send Fortinet Logs from terminal via Kafka. |
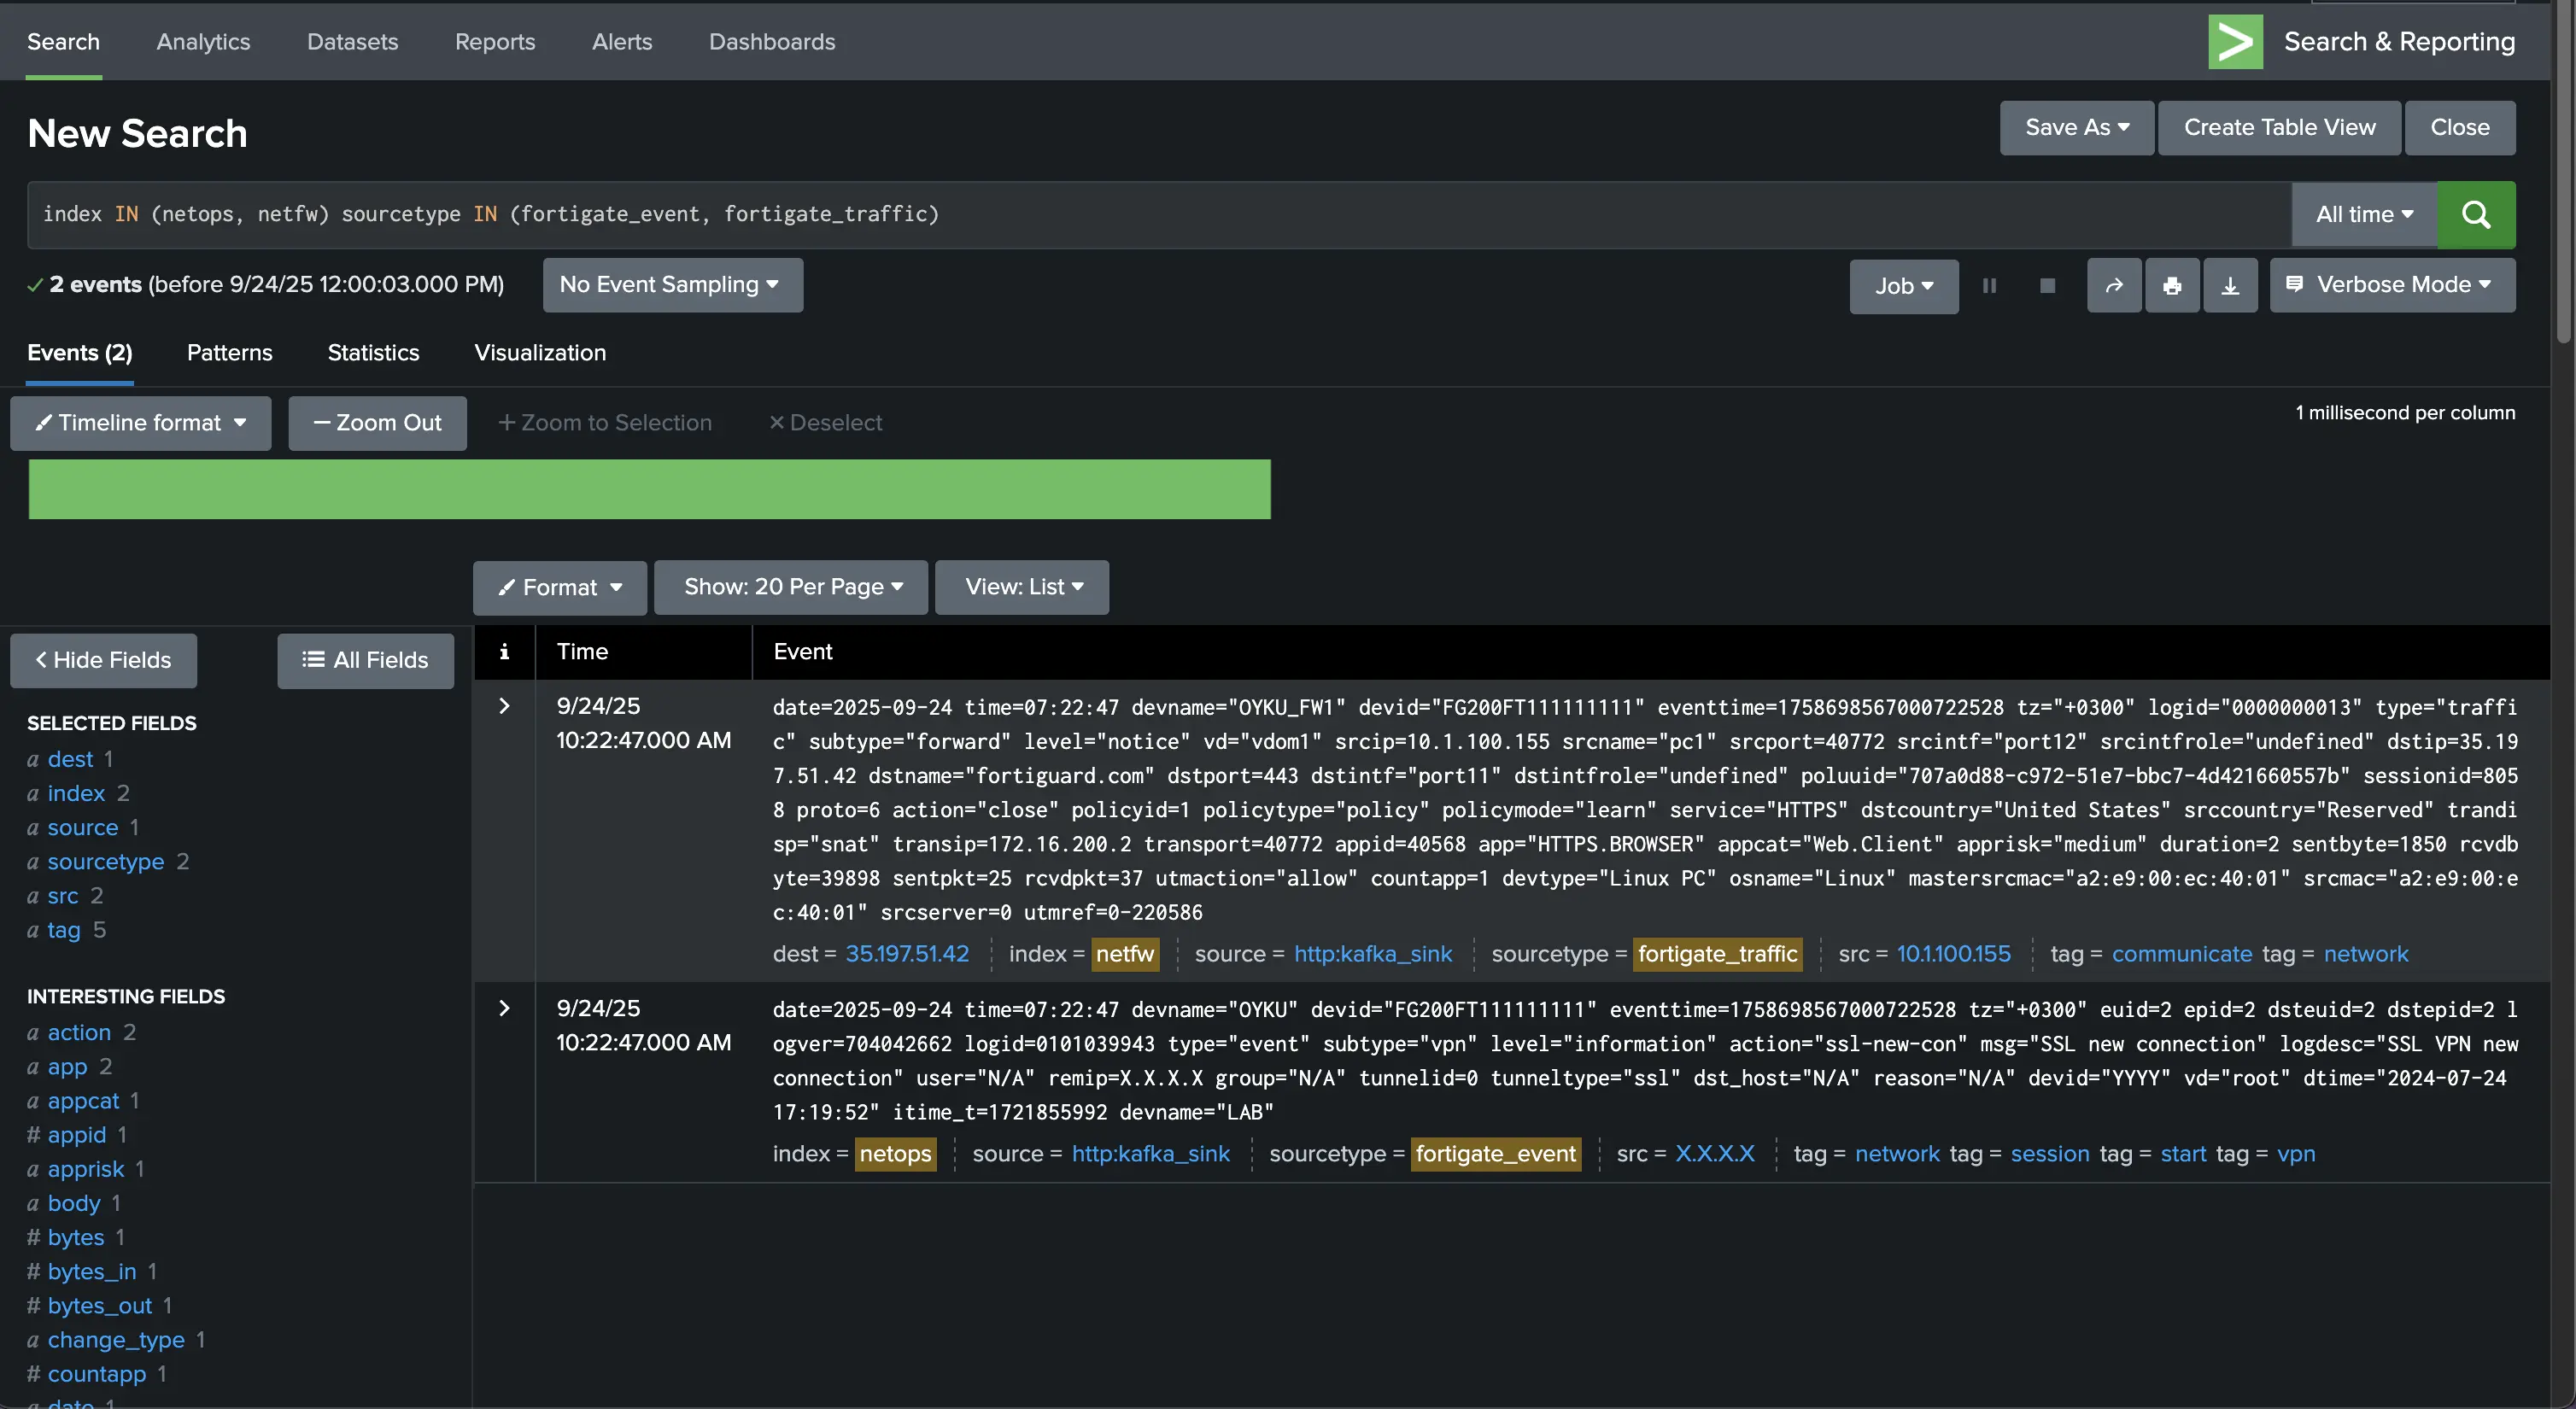 |
|---|
| Figure 2 Event log results on the Splunk. |
✅ At this point, your end-to-end flow is working:
[Fortinet Logs] → [Kafka Topic] → [Kafka Sink Connector] → [Splunk (HEC)] → [Indexed & Parsed]
🔚 Summary
This setup allows you to stream any structured log data from Kafka into Splunk in real-time — whether it’s firewall logs, syslog messages, telemetry data, or custom app events.
- ✅ Kafka → Splunk (via Sink Connector)
📚 More Collection Methods?
This blog is part of a series! Check out the others for alternative log collection pipelines:
- 📥 Streaming rsyslog Events to Kafka
- 📥 Streaming syslog-ng Events to Kafka
- 📥 Send Windows Event Logs to Kafka — The Easy Way with Splunk UF & Splunk S2S Kafka Connector
🙌 Final Thoughts
Getting event logs from Kafka topic into Splunk doesn’t have to be complex — and it doesn’t require proprietary forwarding tools or fragile syslog pipes.
With Kafka in the middle and Splunk’s native HEC input at the edge, we built a resilient pipeline that:
- 🧠 Prepares logs before they hit the indexer
- 🔄 Allows routing, enrichment, and replay
- 🚀 Scales horizontally with your infrastructure
Whether you’re using syslog-ng, other vendor products or simply writing to Kafka topics via APIs, this connector makes your life easier.
Wrapping Up
That’s a wrap! 🎉 You’ve now built a fully functional streaming bridge from Fortinet → Kafka → Splunk — complete with timestamp extraction, metadata routing, and parsing-ready events. • ✅ Modular • 🔍 Parse-friendly • 🧩 Add-on compatible • 💡 Ready for production
Got questions? Use cases? Pipeline horror stories?
I’d love to hear about them! You can always reach me on LinkedIn or via comments on the blog.
Until next time — Happy logging! 🚀📊
References:
- [1] Splunk Inc. (2025). Splunk Add-on for Fortinet FortiGate. Splunkbase. https://splunkbase.splunk.com/app/2846
- [2] Splunk Inc. (2025). Splunk Connect for Kafka. Splunk. https://help.splunk.com/en/splunk-cloud-platform/get-data-in/splunk-connect-for-kafka/2.2/overview/splunk-connect-for-kafka
- [3] Fortinet (2025). FortiOS Log Message Reference — Field Descriptions. https://docs.fortinet.com/document/fortigate/7.4.3/fortios-log-message-reference/357866/log-message-fields
- [4] Splunk Inc. (2025). Splunk Connect for Syslog (SC4S) — Fortinet FortiOS Source Configuration. https://splunk.github.io/splunk-connect-for-syslog/main/sources/vendor/Fortinet/fortios/
- [5] Confluent Hub (2025). Splunk Kafka Connect Sink Connector. https://www.confluent.io/hub/splunk/kafka-connect-splunk
- [6] Simsir Can, Ö. (2025). Send Windows Event Logs to Kafka — The Easy Way with Splunk UF & Splunk S2S Kafka Connector. https://blog.seynur.com/splunk/2025/09/18/streaming-windows-events-to-kafka-with-s2s-connector.html
- [7] Simsir Can, Ö. (2025). Streaming syslog-ng Events to Kafka: A Practical Guide You Can Follow. Seynur Blog. https://blog.seynur.com/kafka/2025/09/15/streaming-syslog-ng-events-to-kafka.html
- [8] Simsir Can, Ö. (2025). Streaming rsyslog Events to Kafka. Seynur Blog. https://blog.seynur.com/kafka/2025/09/17/streaming-rsyslog-events-to-kafka.html
- [9] Splunk Inc. (2025). Splunk Add-on for Microsoft Windows Documentation. https://splunk.github.io/splunk-add-on-for-microsoft-windows/
- [10] Splunk Inc. (2025). Splunk Add-on for Microsoft Windows. Splunkbase. https://splunkbase.splunk.com/app/742
- [11] Confluent. (2025). Splunk S2S Source Connector for Confluent Platform. https://docs.confluent.io/kafka-connect-splunk-s2s/current/