Routing and Masking Linux Logs with Splunk Edge and OpenTelemetry
🚀 1. Introduction
Linux-based environments are continuously producing a huge amount of data every second. Be it from logs by journald or the kernel, authentication, or other service logs, it can quickly become overwhelming and noisy to manage.
Often times, the problem isn’t only about how logs can be collected; it’s about what should be done to process the logs effectively before indexing.
Here are some common problems that may come across:
- The existence of logs in Linux from different sources and transports
- The presence of nested information in journald events
- Combining syslog events with JSON data
- Diverse log sources requiring distinct sourcetype configurations
- Sensitive information appearing in plain events, such as IP addresses
- Traditional index-time parsing increasing ingestion and storage overheads
For this POC, I chose to make use of Splunk Edge Processor and OpenTelemetry Collector Contrib (otelcol-contrib) for preprocessing Linux logs before ingesting into Splunk.
The following were the key requirements of the POC:
- Gathering Linux logs from multiple sources via a single pipeline
- Dynamically detecting events’ sourcetype
- Directing information to appropriate indexes
- Masking sensitive IP addresses
- Simplifying log parsing at the indexing time
What is really awesome about this architecture is the fact that all processing is done before the events are actually indexed in Splunk.
Contrary to using lots of search time or index-time parsing, Splunk Edge Processor acts like a clever pre-processing stage between your data source and indexing.
Here is how it went for us during our POC:
- otelcol-contrib was in charge of log collection.
- Splunk Edge Processor did the job of routing, classifying, and masking events.
- Indexing and search were done using Splunk Enterprise.
And here we go – we have a very flexible and light pipeline, able to ingest both journald and syslog Linux log events from a single place!
2. Architecture Overview
As for this proof-of-concept implementation, I wanted to develop a small and lean Linux log processing pipeline that could accept multiple log sources through a single ingestion point.
The system was intentionally simplified as follows:
- Single Ubuntu-based virtual machine
- Splunk Enterprise
- Splunk Edge Processor
- OpenTelemetry Collector Contrib (otelcol-contrib)
Although everything is deployed on the same VM for convenience purposes, we still have a real edge-processing pipeline here.
The following architecture can be seen here:
Linux Log Sources
    │
    ├── journald (/var/log/journal)
    └── Syslog-style application logs (/var/log/edge-poc/otel-app.log)
            │
            ▼
OpenTelemetry Collector Contrib
            │
            ▼
Splunk Edge Processor
    ├── Sourcetype classification
    ├── Index routing
    ├── IP masking
    └── Log preprocessing
            │
            ▼
Splunk Enterprise
Here OpenTelemetry Collector was only required to collect and forward the logs to the next processing point.
A real event preprocessor was Splunk Edge Processor.
Based on the analysis of an incoming event, Edge pipeline could define:
- appropriate sourcetype
- destination index
- whether IP needs to be masked
- membership of Linux security events, Linux kernel events, journald events, or generic syslog datasets
There are two log sources in the proof-of-concept pipeline.
2.1. Journald Logs
The first type of logs were from the system journal available at the following location:
/var/log/journal
This type of event data is collected by means of the journald receiver module within otelcol-contrib.
Sample event:
{
   MESSAGE: pam_unix(sudo:session): session closed for user root
   PRIORITY: 6
   SYSLOG_FACILITY: 10
   SYSLOG_IDENTIFIER: sudo
   SYSLOG_TIMESTAMP: May 15 13:35:35
   _AUDIT_LOGINUID: 1000
   _AUDIT_SESSION: 1
   _BOOT_ID: 2fcc08205525457daa218cae474e82cf
   _CAP_EFFECTIVE: 1ffffffffff
   _CMDLINE: sudo systemctl status otelcol-contrib
   _COMM: sudo
   _EXE: /usr/lib/cargo/bin/sudo
   _GID: 0
   _HOSTNAME: oyku-ubuntu
   ...
   __SEQNUM_ID: 4f8e3233470743ae92a789cf2dfcfaeb
}
2.2. Syslog-Style Application Logs
The second source of data was a JSON file with embedded syslog-type message entries:
/var/log/edge-poc/otel-app.log
An example of one entry is shown below:
{
  "message":"<15>May 13 09:47:37 10.10.10.10 dhclient[3209]: DHCPREQUEST on eth0 to 10.10.10.1 port 67"
}
These logs posed some additional challenges:
- typical syslog format
- embedded IP address
- inconsistent names of daemons
- various event types in a single file
As such, it made more sense to perform normalization and routing at the level of Splunk Edge Processor.
Since the entire testbed was hosted on one VM, a minor adjustment had to be done when preparing the environment.
Usually:
- Splunk Enterprise receives events from the port 9997
- HEC listens to port 8088
But since we also had Splunk Edge Processor that required its own ingestion components, it was decided to reconfigure environment in the following way:
| Component | Port | |
|---|---|---|
| Splunk Edge Processor | 9997 | |
| Splunk Enterprise S2S Input | 9998 | |
| Splunk Edge Processor HEC | 8088 | |
| Splunk Management Port | 8089 |
3. Simple and Easy Setup of the OpenTelemetry Collector
Let’s have a look at the OpenTelemetry Collector setup. In the context of our POC, we made sure the setup is easy to follow.
There are two main tasks that should be performed by the collector:
- It should read logs from multiple Linux systems.
- It needs to send everything to the Splunk Edge Processor.
In our case, we decided to install the otelcol-contrib, which includes all necessary receivers for collecting data from the Linux systems:
filelogjournald
Here is how you can install the otelcol-contrib on the Ubuntu system:
sudo apt-get install otelcol-contrib
Don’t forget to add the service account to the systemd-journal group to allow the OpenTelemetry Collector to access the journals:
sudo usermod -aG systemd-journal otelcol-contrib
Otherwise, you will get the following error message:
No journal files were opened due to insufficient permissions.
Now that we got the OpenTelemetry Collector installed, let’s have a look at its configuration that uses two main receivers.
3.1. JSON Log File Collection
The first receiver continuously monitors a JSON log file that stores syslog events. Below is its configuration:
filelog:
  include:
    - /var/log/edge-poc/otel-app.log
  start_at: beginning
  operators:
    - type: json_parser
3.2. Journald Collection
In our second configuration, logs are collected straight from the Linux system journald, enabling straightforward collection of essential events:
journald:
  directory: /var/log/journal
In this case, the collector is able to record native Linux events, which include:
sudosystemdkernelsshd- lifecycle events
3.3. Sending the Logs to the Splunk Edge Processor via HTTP Event Collector (HEC)
The next step is to send the logs to our Splunk Edge Processor via HEC. This is what I have in my /etc/otelcol-contrib/config.yaml:
receivers:
  filelog:
    include:
      - /var/log/edge-poc/otel-app.log
    start_at: beginning
    operators:
      - type: json_parser

  journald:
    directory: /var/log/journal

extensions:
  health_check:
    endpoint: 0.0.0.0:13133

  pprof:
    endpoint: 0.0.0.0:1977

processors:
  batch:

  resource:
    attributes:
      - key: service.name
        value: otel-filelog-poc
        action: upsert
      - key: deployment.environment
        value: lab
        action: upsert
      - key: host.name
        value: oyku-ubuntu
        action: upsert

  attributes:
    actions:
      - key: app
        value: edge-poc
        action: upsert
      - key: telemetry_source
        value: otelcol-contrib
        action: upsert

exporters:
  splunk_hec:
    endpoint: "http://oyku-ubuntu:8088/services/collector"
    source: "otel-filelog"
    token: "dummy"

service:
  extensions: [health_check, pprof]

  pipelines:
    logs:
      receivers: [filelog, journald]
      processors: [resource, attributes, batch]
      exporters: [splunk_hec]

  telemetry:
    metrics:
      readers:
        - pull:
            exporter:
              prometheus:
                host: localhost
                port: 1979
My config is minimalistic and only deals with collection and forwarding. The OpenTelemetry Collector is responsible for ingesting the logs from the two sources mentioned above. However, the processing and classifying of the data are done at the Splunk Edge Processor side.
It is worth mentioning that an extra health check, pprof, and Prometheus metrics are also useful if you need to monitor the collector itself and troubleshoot any issues within the local POC environment.
At this stage, the collector does nothing but:
collect → forward
In case you wish to learn more about the configuration and other concepts related to OpenTelemetry Collector like receivers, processors, exporters, and pipelines, check out the official documentation: https://opentelemetry.io/docs/collector/configuration/
4. Installing Splunk Edge Processor
After you have successfully deployed Splunk Enterprise, your next challenge is to activate and install the Splunk Edge Processor.
It’s not difficult to install the Splunk Edge Processor. You just need to go to the Splunk Web portal via Apps > Data Management.
Splunk will make your journey easy. For more detailed information on installation, refer to the following link:
Getting Started with Edge Processor
4.1. Initial Set-up
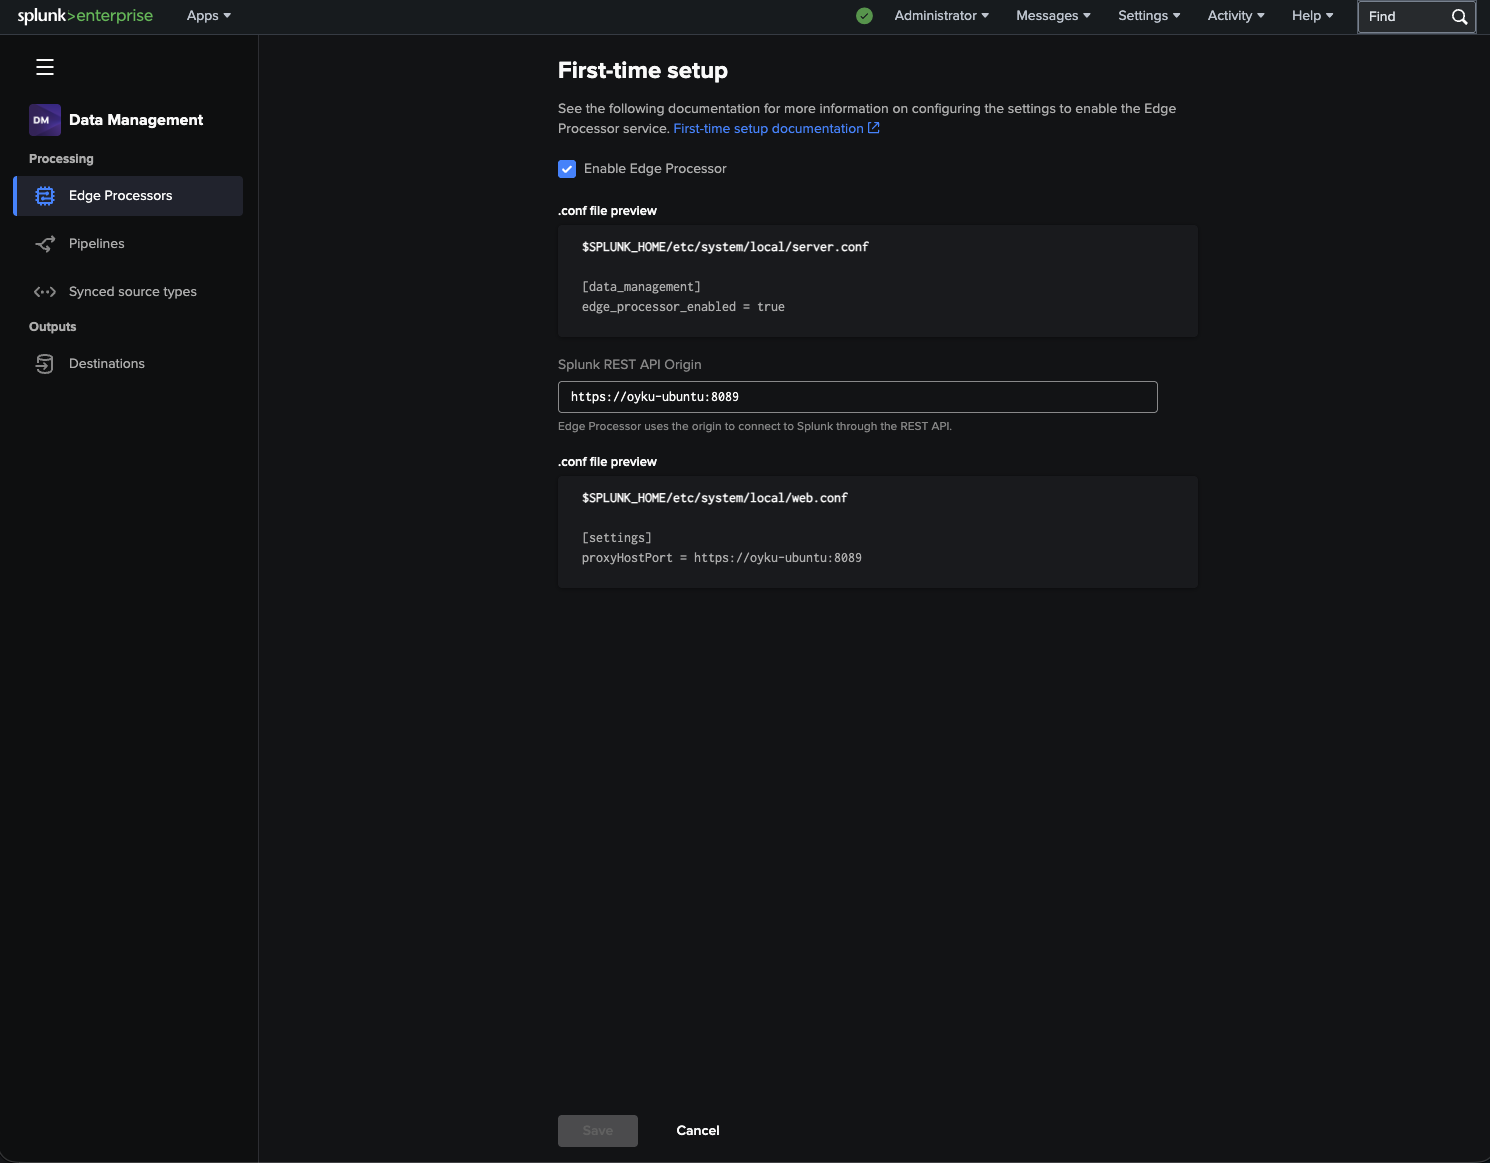
When you initially set up your edge processor, Splunk will ask you for the REST API origin to allow Edge Processor to connect with Splunk Enterprise.
 |
|---|
| Figure 1: Initial Edge Processor setup screen inside Splunk Enterprise. |
As the POC was running on an Ubuntu virtual machine, we configured the Splunk management endpoint port as 8089.
First time setup is pretty easy and includes the following points:
- Activate Edge Processor
- Set Splunk REST API origin
- Generate the configuration automatically for you
It will configure your server.conf and web.conf files.
4.2. Configure Receiver Settings
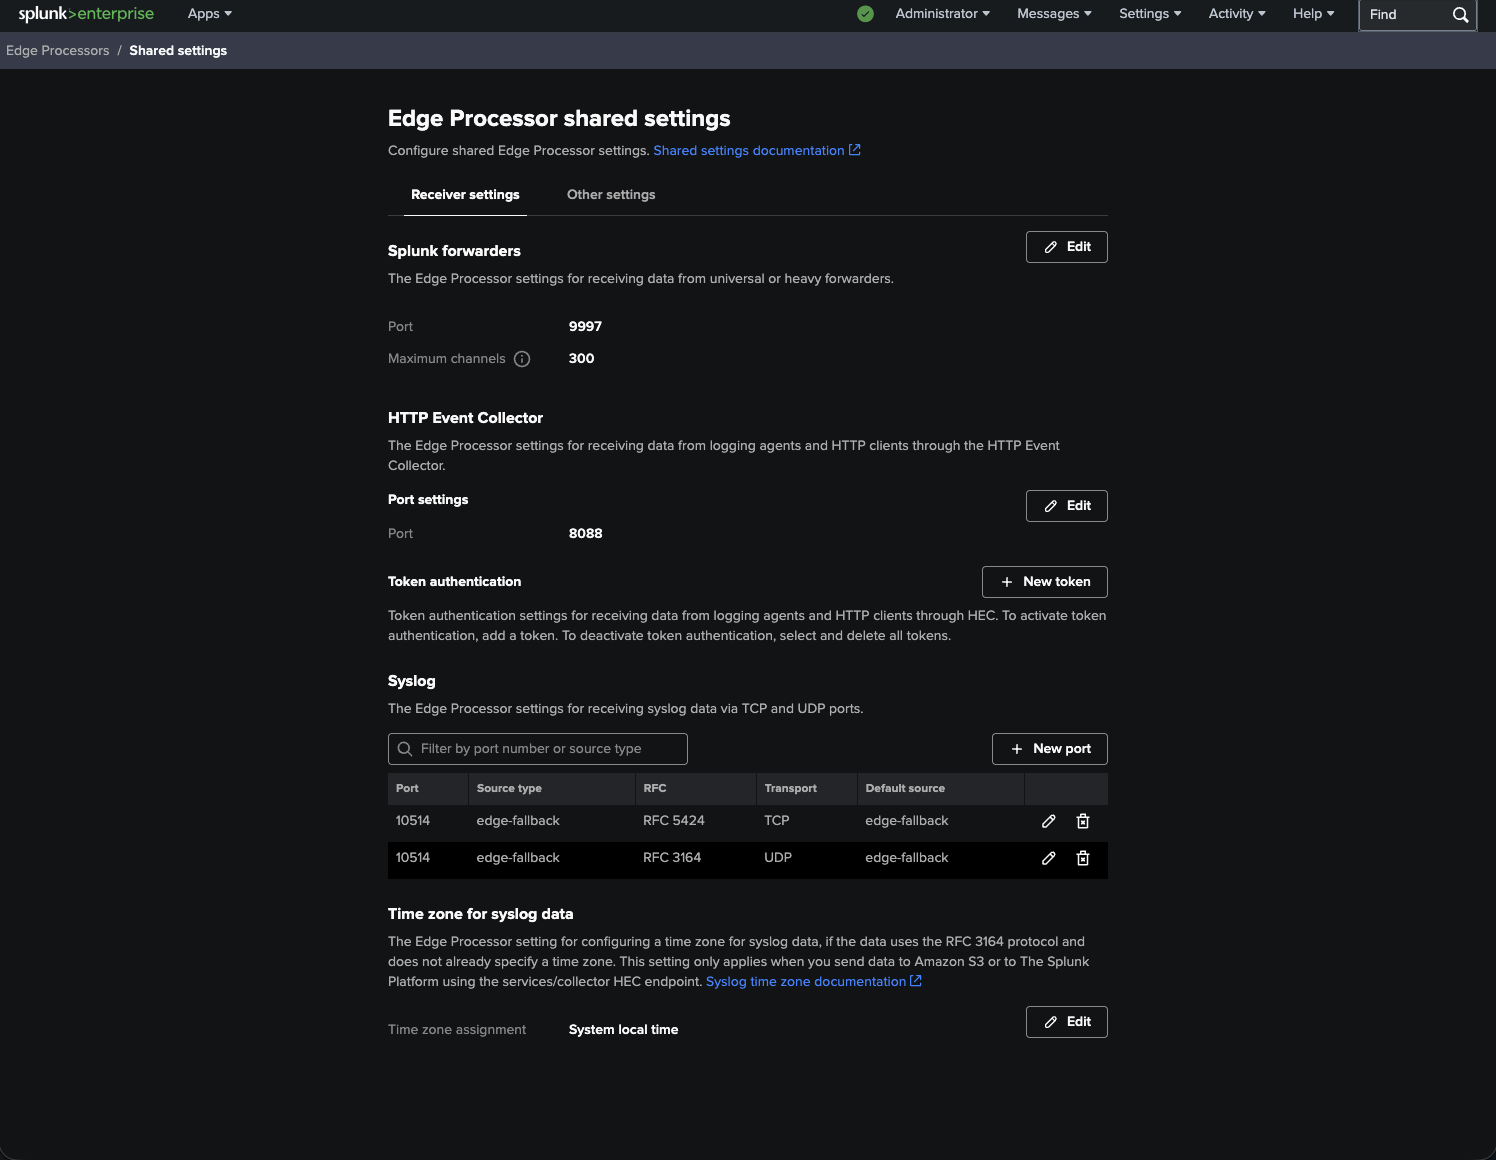
After activating Edge Processor, you can see that receiver settings are accessible.
 |
|---|
| Figure 2: Receiver settings for HEC, Splunk Forwarder, and Syslog inputs. |
In our case:
- We used the Splunk Forwarder input on port 9997.
- HTTP Event Collector (HEC) input on port 8088 was used.
Logs were collected using the HEC receiver of the OpenTelemetry Collector and forwarded to Edge Processor.
As both Splunk Enterprise and Edge Processor services were set up on the same machine, we modified the receiver settings for Splunk Enterprise to collect indexed data from port 9998 instead of the default port 9997.
4.3. Edge Processor Creation
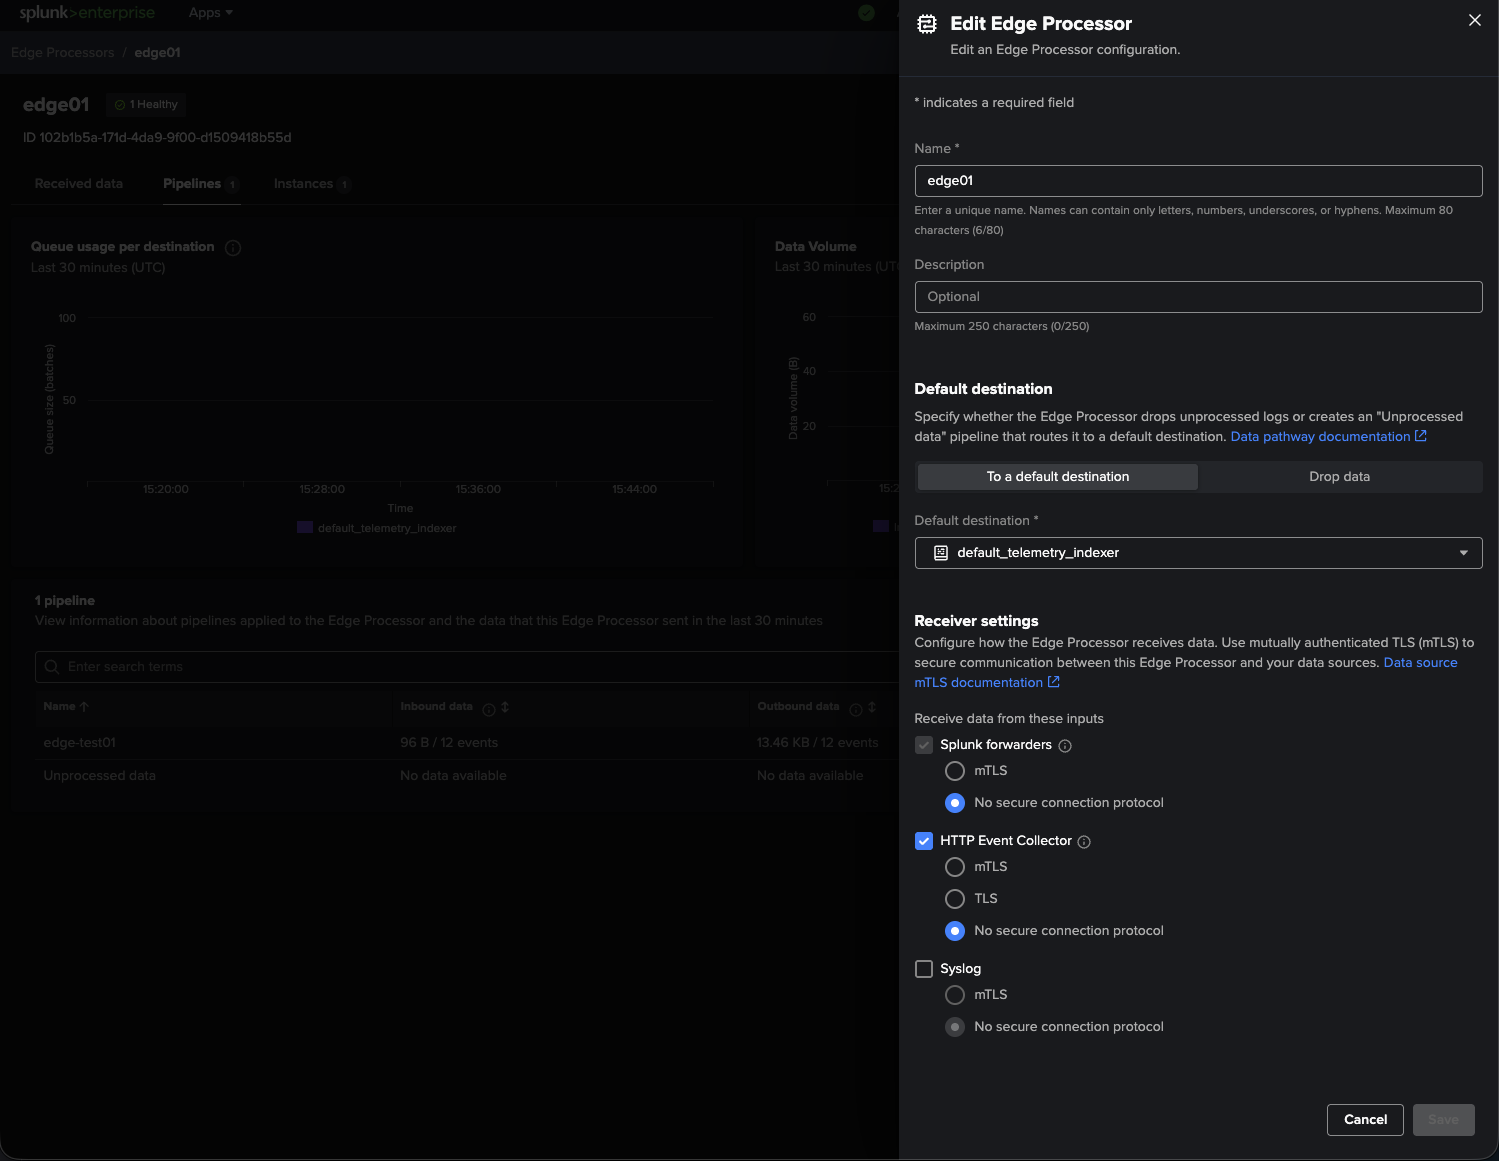
It’s now time to create our Edge Processor directly from the UI!
Since our destination indexer is configured with the default settings, the Edge Processor would use this setting to send data back to the same Splunk instance that exists on our VM.
 |
|---|
| Figure 3: Creating the Edge Processor configuration and selecting the default destination. |
In its current state, our Edge Processor will:
- Get data via HEC
- Execute SPL2 pipelines
- Send processed data back to Splunk Enterprise
4.4. Edge Processor Installation
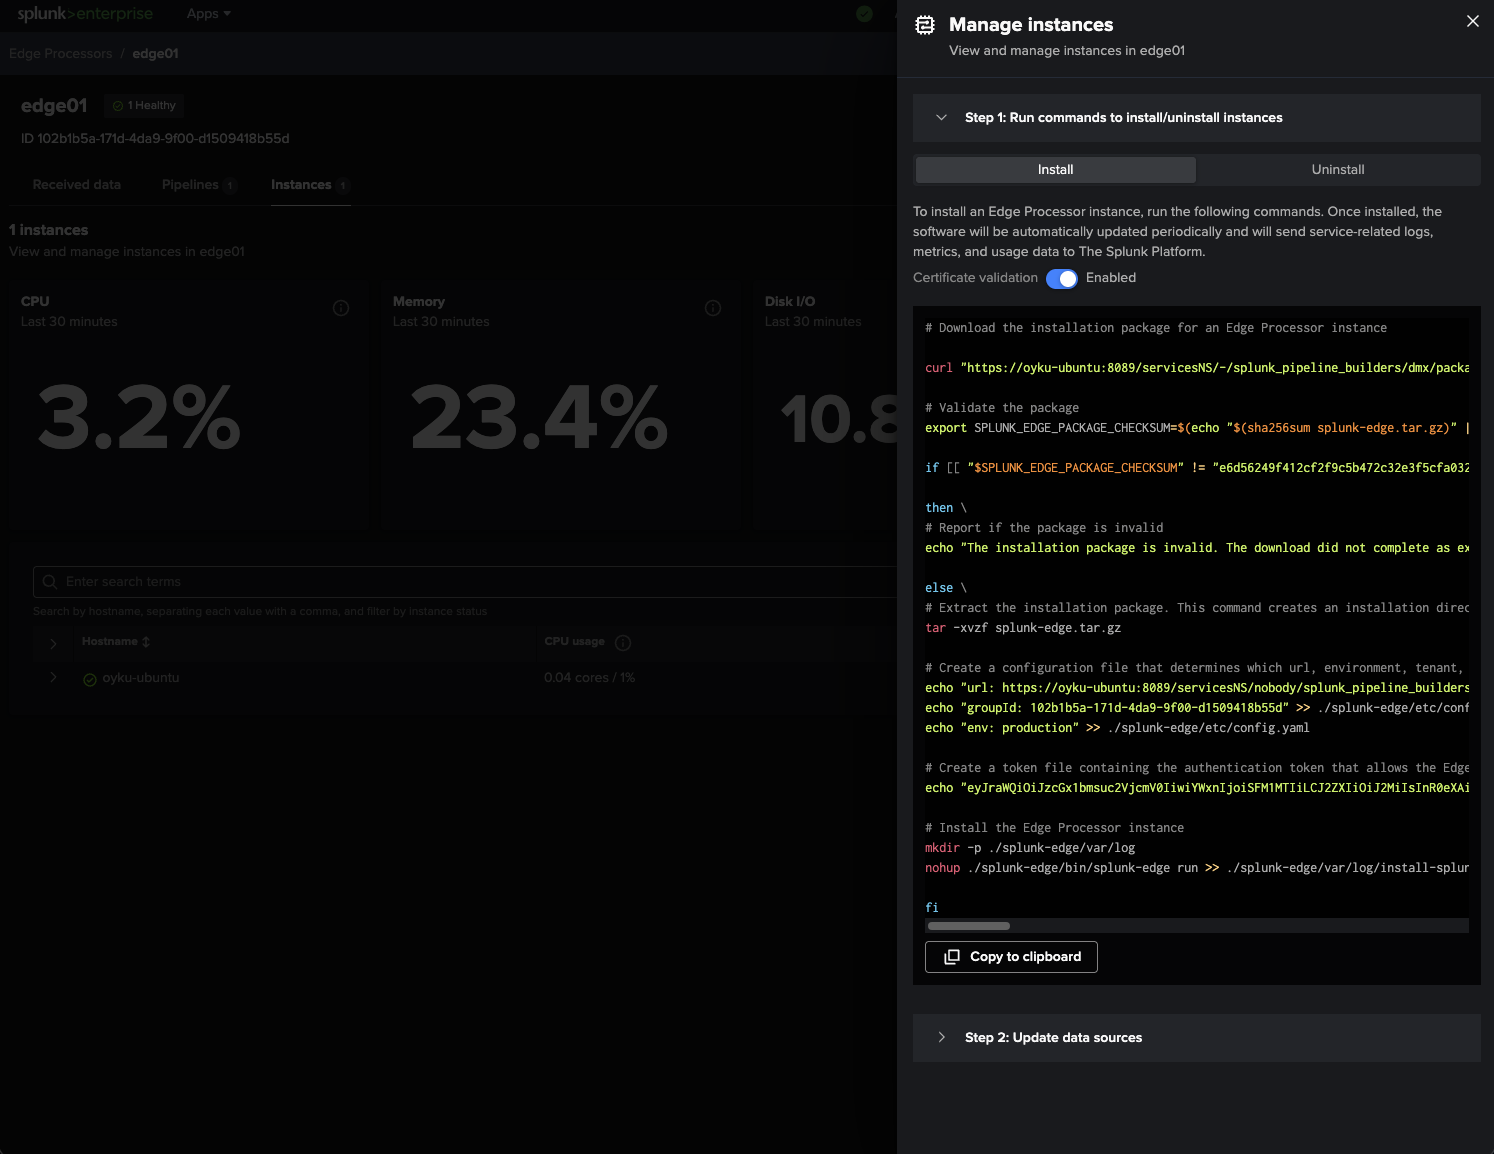
What I like most about working with Edge Processor is the possibility of getting installation commands automatically generated by Splunk!
We’ll simply navigate to Apps > Data Management > Edge Processors > Instances > Manage Instances to see all we need:
- Edge Processor installer package
- Configured Edge Processor
- Token
- Edge Processor startup command
All I did was copy the provided command and execute it straight from my Ubuntu VM without any modifications!
 |
|---|
| Figure 4: Automatically generated installation commands for the Edge Processor instance. |
And before I realized, I got the Edge instance connected back to Splunk.
Splunk gives you uninstall commands too if you ever feel like cleaning everything up.
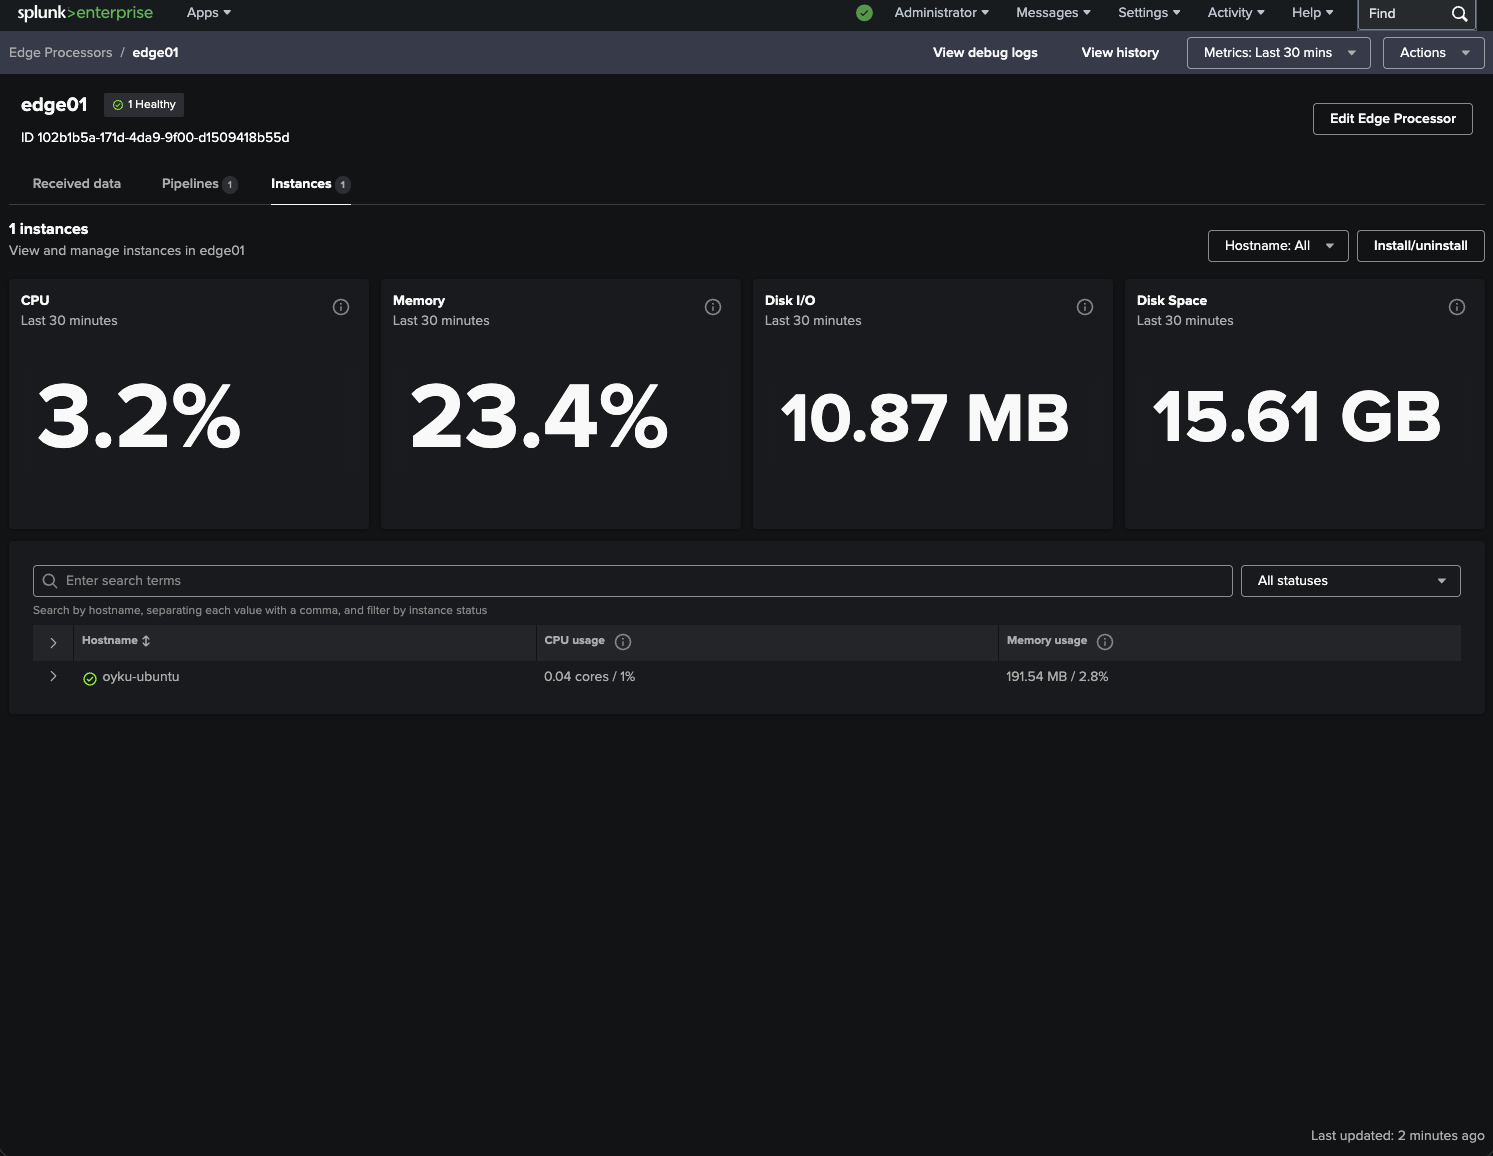
4.5. Validate the Deployment
Last but not least, the Edge Processor Dashboard ensures that all is well! It will demonstrate that the instance is in good shape and doing its job of crunching numbers.
 |
|---|
| Figure 5: Healthy Edge Processor instance with live resource metrics. |
Some useful metrics include:
- CPU Utilization
- Memory Utilization
- Disk I/O
- Pipeline Processing
- Instance Status
- Queues
Performing the whole POC using one VM running Ubuntu Linux was really convenient to develop.
5. Splunk Edge Pipeline Processing Logic
With the logs successfully sent through the OpenTelemetry Collector, we moved on to another very interesting part of our POC – preprocessing events before forwarding to Splunk.
This step is where the Splunk Edge Processor really comes into play as the core of our solution’s architecture.
The pipeline was supposed to perform the following actions:
- Proper classification of events into different sourcetypes
- Event routing to different indexes
- Masking of sensitive IP addresses before indexing
Given that our logs contained events with diverse formats and origins, it was extremely hard to stick to one static sourcetype.
As examples of logs processed within one pipeline, we can cite the following:
- Native journald logs
- Linux authentication logs
- Kernel logs
- Syslogs from daemons
- Internal logs from the OpenTelemetry Collector
- Application logs wrapped in JSON format
To cope with that task, we applied dynamic conditional matching in our pipeline.
The resulting pipeline looks like this:
$pipeline = | from $source

/** Deciding on the Sourcetype **/
| eval sourcetype=case(
 match(_raw, /SYSLOG_IDENTIFIER("| ):("| )(sudo|sshd|su|passwd|useradd|groupadd|userdel|groupdel)("| )/), "linux_secure",
 match(_raw, /("| )_TRANSPORT("| ):("| )kernel("| )/) OR match(_raw, /SYSLOG_IDENTIFIER("| ):("| )kernel("| )/), "linux:kernel",
 match(_raw, /( |")systemd(:|\[|")/), "linux:systemd",
 match(_raw, /( |")dhcp(:|\[|")/), "linux:dhcpd",
 match(_raw, /( |")(gravity|rsyslogd|dhclient)(:|\[|")/), "syslog",
 match(_raw, /SYSLOG_IDENTIFIER("| ):("| )otelcol-contrib("| )/), "otelcol:internal",
 match(_raw, /("| )_SYSTEMD_UNIT("| ):/), "linux:journald:service",
 1=1, "linux:journald"
)

/** Deciding on the Index **/
| eval index=case(like(sourcetype, "linux%") OR sourcetype == "syslog", "osnix",
 sourcetype=="otelcol:internal", "otel",
 1=1, "edge_poc"
)

/** Check if IP masking is required and implement it **/
| eval _raw=case(
 match(_raw, /[0-9]{1,3}\.[0-9]{1,3}\.[0-9]{1,3}\.[0-9]{1,3}/),
 replace(_raw, /[0-9]{1,3}\.[0-9]{1,3}\.[0-9]{1,3}\.[0-9]{1,3}/, "x.x.x.x"),
 1=1,
 _raw
)

| into $destination;
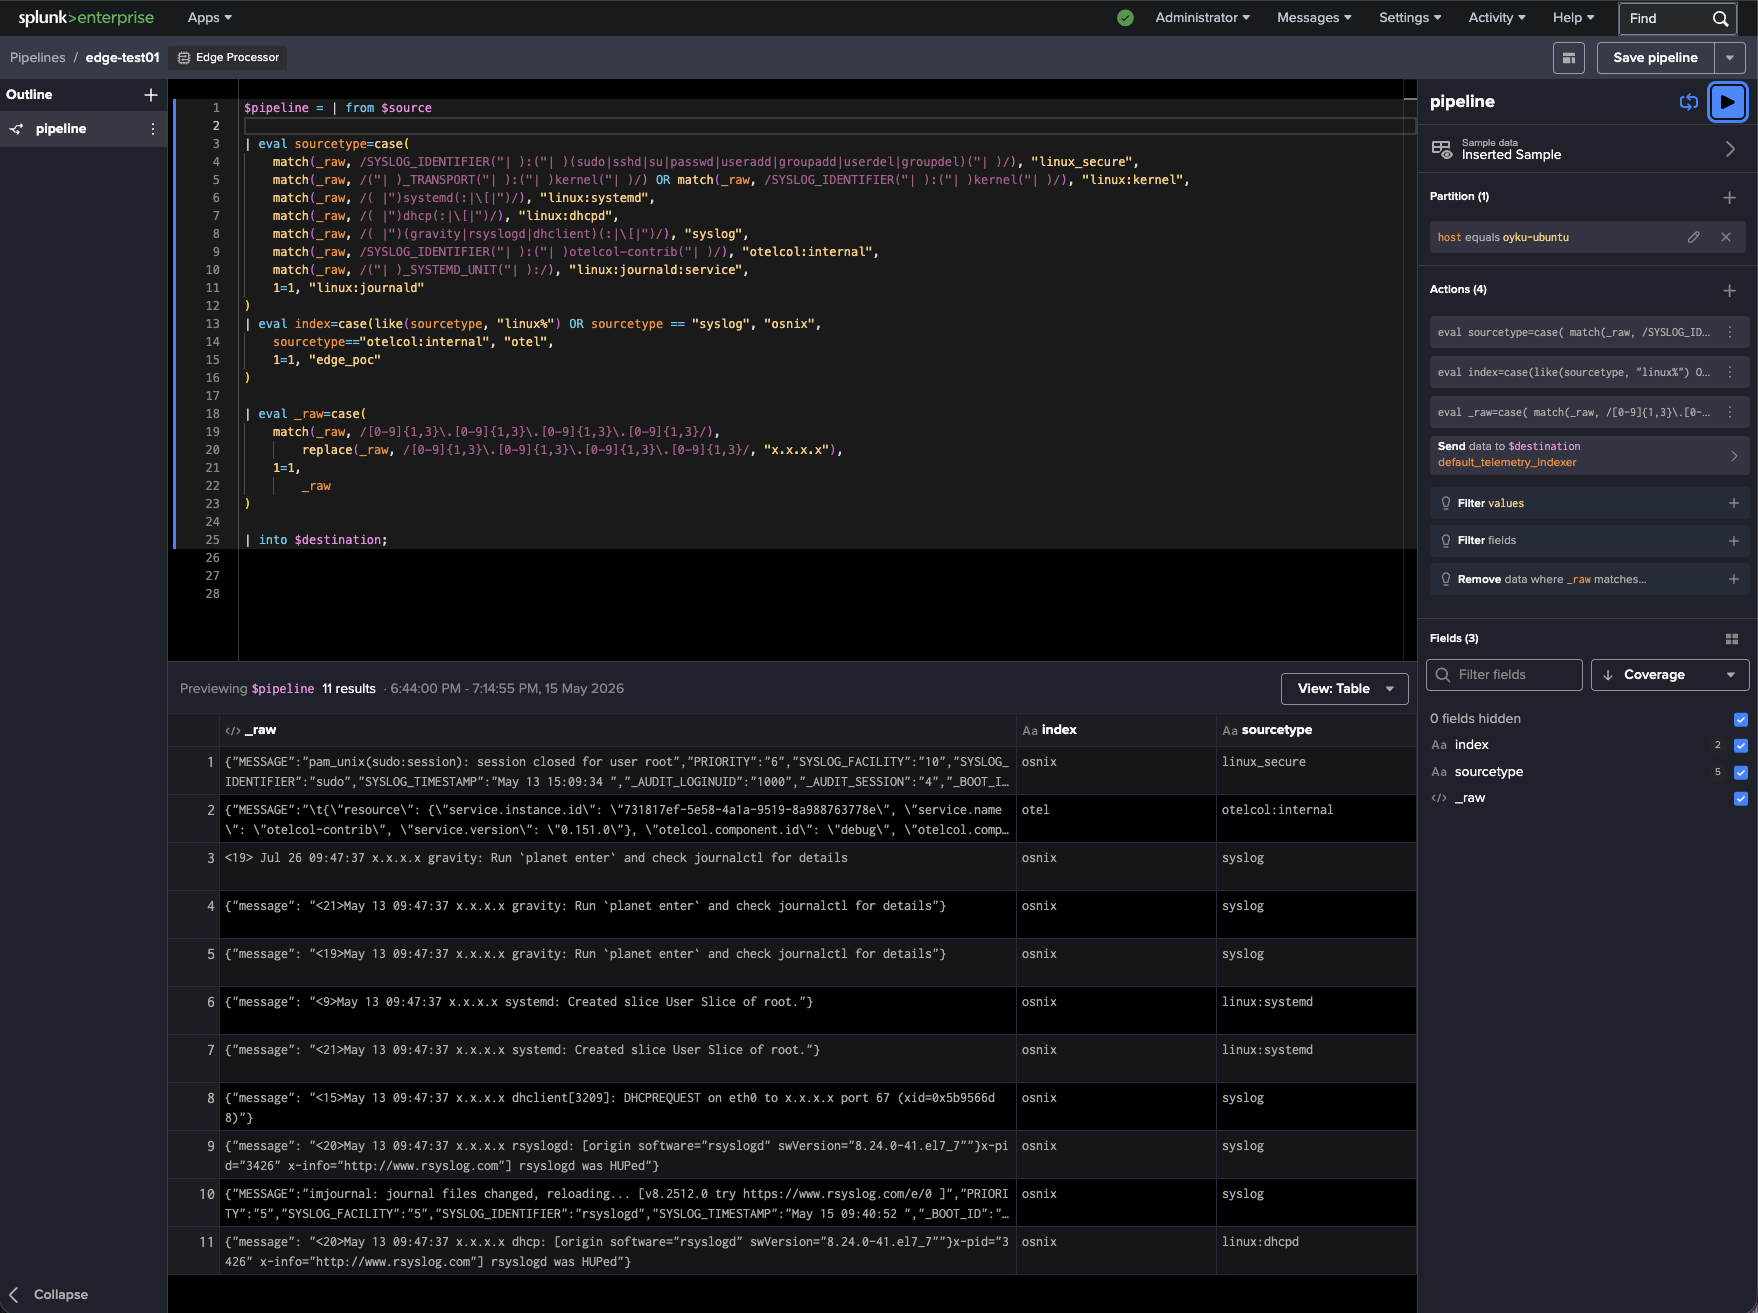
Once the Edge case had healed, then the next task was constructing the SPL2 pipeline that would handle pre-processing of the incoming Linux telemetry.
By utilizing the Edge Processor UI, it was now feasible to live-preview the events and assign sourcetypes, indexes, and mask out data during the pre-indexing phase.
 |
|---|
| Figure 6: SPL2 pipeline performing sourcetype classification, index routing, and IP masking in Splunk Edge Processor. |
As seen from the above diagram, the SPL2 pipeline detects events depending on their format and information content, after which it determines the correct sourcetype and index for each type of events.
The same SPL2 pipeline masks IP addresses before indexing them into Splunk at the edge layer.
Here are a few common event patterns we support:
| Pattern Type | Sourcetype | Index | |
|---|---|---|---|
| Authentication events | linux_secure | osnix | |
| Kernel events | linux:kernel | osnix | |
| Systemd events | linux:systemd | osnix | |
| Generic syslog events | syslog | osnix | |
| OTEL Collector internal events | otelcol:internal | osnix | |
| Journald fallback events | linux:journald | osnix |
It was notable how certain regex operations were too aggressive, leading to certain journald events not being sent to downstream processing altogether. The workaround for this problem was to conditionally wrap these actions in if(match()), which would perform them only if the corresponding IP addresses were found in the event.
It was a great lesson on how one must design the preprocessing pipeline when dealing with such a wide variety of Linux telemetry.
If you wish to find out more about SPL2, I would strongly encourage looking at the Splunk documentation on SPL2! The documentation will teach you about the SPL2 syntax, how to transition from SPL to SPL2, and give you some information about the SPL2 module editor environment:
- Getting Started with Searching Data Using SPL2
- Converting SPL to SPL2
- Overview of the SPL2 Module Editor
You can also dive into SPL2 pipelines yourself through the Splunk Search Module interface found here:
/app/search/module
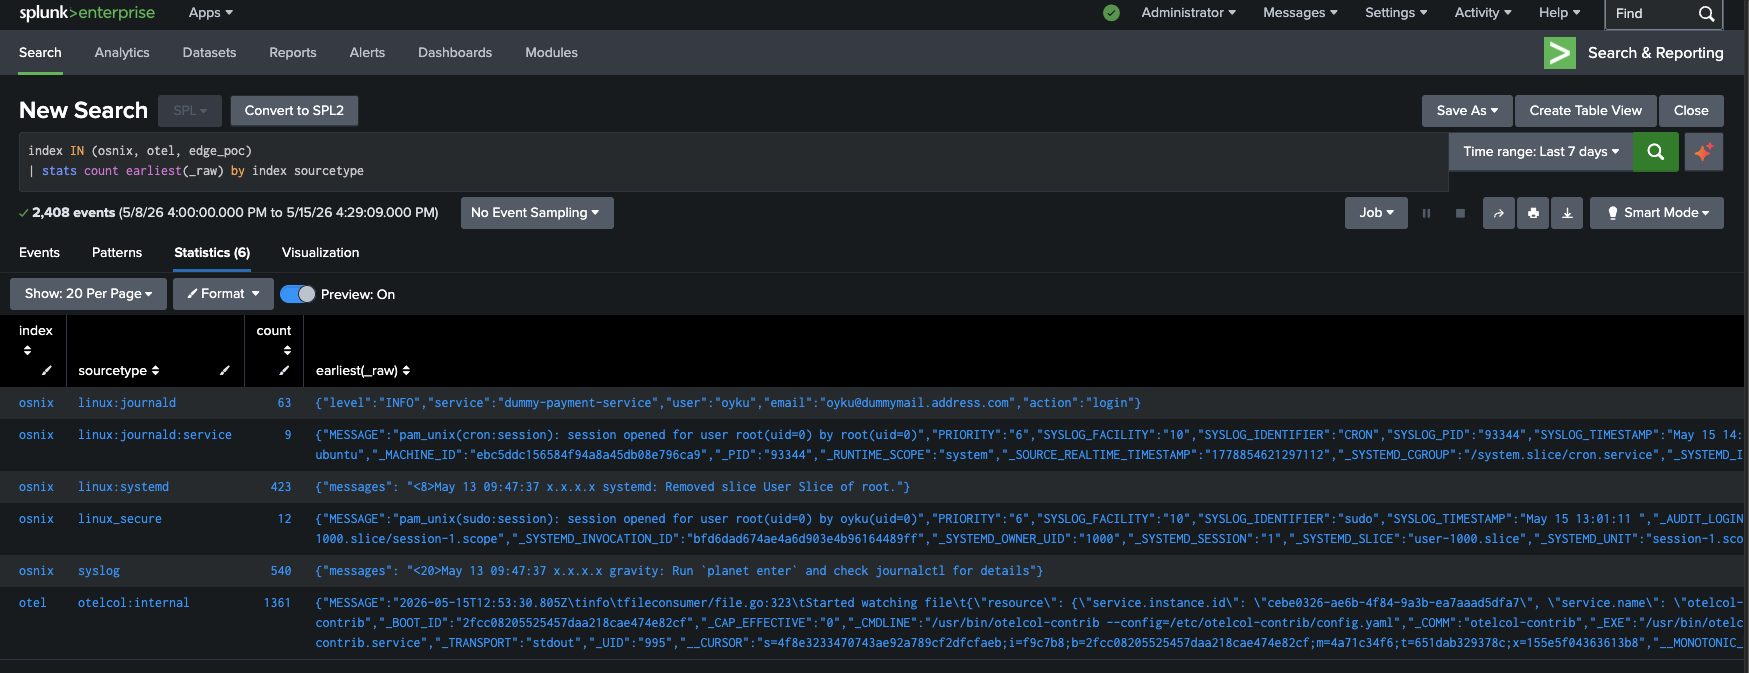
6. Final Results
As expected, I’m happy to report that by completing the SPL2 pipeline, it’s possible to retrieve the processed events with dynamically classified sourcetypes and indexes from Splunk! Below, you’ll find the corresponding screenshot illustrating how various Linux logs have been successfully split to distinct indexes with IP masking applied to hide the actual IP addresses before indexing.
 |
|---|
| Figure 7: Final indexed events after edge-side routing, sourcetype classification, and IP masking. |
As you can notice from the above screenshot, the event separation performed perfectly. As a result, we have:
- linux_secure
- linux:journald
- linux:systemd
- syslog
- otelcol:internal
which were routed into indexes such as:
- osnix
- otel
The best part of what we achieved was the IP masking performed on the edge layer itself, which prevented any sensitive infrastructure information from reaching the indexing tier in the unmasked form.
At this stage, our whole pipeline was working perfectly:
Linux Logs → OpenTelemetry Collector → Splunk Edge Processor → SPL2 Pipeline → Splunk Indexes
Even within an easy single-node POC deployment, we saw that Splunk Edge Processor was capable of processing Linux logs properly and performing necessary preprocessing operations before feeding them to the indexing layer.
Such a solution provides a good example of the powerful capabilities of OpenTelemetry Collector and Splunk Edge Processor that allow building flexible, centralized, and ingestion-aware preprocessing pipelines for Linux telemetry.
6.1. Important Note
One thing worth noting about this POC is that there were some Linux events that did not fully comply with expectations created by default settings of the Splunk app, Splunk_TA_nix.
The fact that many telemetry logs were in JSON made some events parsing fail since they did not comply with expectations related to field extraction and sourcetypes set up by the add-on.
In order to get everything done successfully, I had to perform some custom configurations using my own local app during POC execution. If you consider using Edge-processed Linux telemetry in combination with Splunk CIM model or any Splunk app, I would recommend doing the same.
7. Conclusion
It is an honor for us to present the findings of our proof of concept that proved the possibility of using the OpenTelemetry Collector along with the Splunk Edge Processor for pre-processing Linux telemetry.
In our POC, we achieved several remarkable feats while using just one VM running Ubuntu operating system:
- We managed to gather the logs produced by multiple Linux systems
- We dynamically categorized the event data into distinct sourcetypes
- We segregated data across various indexes
- We masked the IPs associated with the events at the edge level
All of this happened without sending any data to the Splunk indexers!
One of the most remarkable aspects of our architecture is the extensibility of our pre-processing layer. Our SPL2 pipeline was capable enough to handle:
- Native journald events
- Syslog-based Linux logs
- Telemetry coming from the OpenTelemetry Collector
- Application logs wrapped in JSON
all through a single unified process!
However, one of the main highlights of this POC was the realization that normalizing and defensively preprocessing Linux telemetry data is very important. As you may know, most of the events generated by Linux-based systems come in different, inconsistent or variable formats. Therefore, some trivial parsing and transformation decisions will significantly impact downstream processes.
Although this was only a local POC, it demonstrated the value of preprocessing in edge cases regarding the ease of indexing and routing of sensitive data in Splunk deployments.
Well done! 🎉
Thanks to this project, we now have a very flexible Linux telemetry pipeline that collects, routes, masks, and preprocesses log data before indexing them in Splunk.
💬 I would be more than happy to see your comments, feedbacks, suggestions, or even questions! Feel free to contact me on LinkedIn! 🧚🏽♀️
Until next time! 👋
8. References
[1] Splunk. (n.d.-a). First-time setup instructions for the Edge Processor solution. Splunk Documentation. Retrieved from https://help.splunk.com/en/data-management/process-data-at-the-edge/use-edge-processors-for-splunk-cloud-platform/getting-started/first-time-setup-instructions-for-the-edge-processor-solution#id_6bfcf40a_be1d_41c6_b07b_70305069a7f0–en__First-time_setup_instructions_for_the_Edge_Processor_solution
[2] OpenTelemetry. (n.d.-a). OpenTelemetry Collector Configuration. OpenTelemetry Documentation. Retrieved from https://opentelemetry.io/docs/collector/configuration/
[3] OpenTelemetry. (n.d.-b). OpenTelemetry Collector Configuration. OpenTelemetry Documentation Components. Retrieved from https://opentelemetry.io/docs/collector/components/
[4] Splunk. (n.d.-b). Searching data using SPL2. Splunk SPL2 Search Manual. Retrieved from https://help.splunk.com/en/splunk-cloud-platform/search/spl2-search-manual/getting-started/searching-data-using-spl2
[5] Splunk. (n.d.-c). Convert a search from SPL to SPL2. Splunk SPL2 Search Manual. Retrieved from https://help.splunk.com/en/splunk-cloud-platform/search/spl2-search-manual/converting-spl-to-spl2/convert-a-search-from-spl-to-spl2
[6] Splunk. (n.d.-d). SPL2 Module Editor Overview. Splunk SPL2 Search Manual. Retrieved from https://help.splunk.com/en/splunk-cloud-platform/search/spl2-search-manual/getting-started/spl2-module-editor-overview