If you’ve spent any time managing a Splunk deployment, you’ve almost certainly stared at a dashboard wondering why your data stopped flowing — or why it never started in the first place. Forwarder connectivity issues are one of the most common pain points in Splunk operations, and yet they’re rarely documented in one place with clear, actionable steps.
This guide is that place. Whether you’re working with a Universal Forwarder (UF) or a Heavy Forwarder (HF), this post walks you through how the connection actually works, the tools you need to diagnose it, and the most common failure scenarios — with fixes.
1. UF vs. HF — A Quick Refresher
Before diving into troubleshooting, it helps to remember what differentiates these two forwarder types, because they fail in different ways.
The Universal Forwarder (UF) is a stripped-down Splunk binary. It collects and forwards raw data but doesn’t parse the data. It’s lightweight, low on resources, and widely deployed on endpoints. When it breaks, it’s usually a connectivity or configuration issue — not a processing one.
UF ──(raw bytes)───► Input Processor → Parsing → Merging → Index
The Heavy Forwarder (HF) is a full Splunk instance configured to forward data. It parses and transforms the data locally before sending it downstream. This makes it more powerful but also more complex to troubleshoot — a problem could live in the network layer, the pipeline, or the parsing configuration.
HF ─(parsed events (post-merging))──► Input Processor → (lighter parsing) → Index
2. How Forwarder-to-Indexer Communication Works
Understanding the handshake helps you know where to look when it fails.
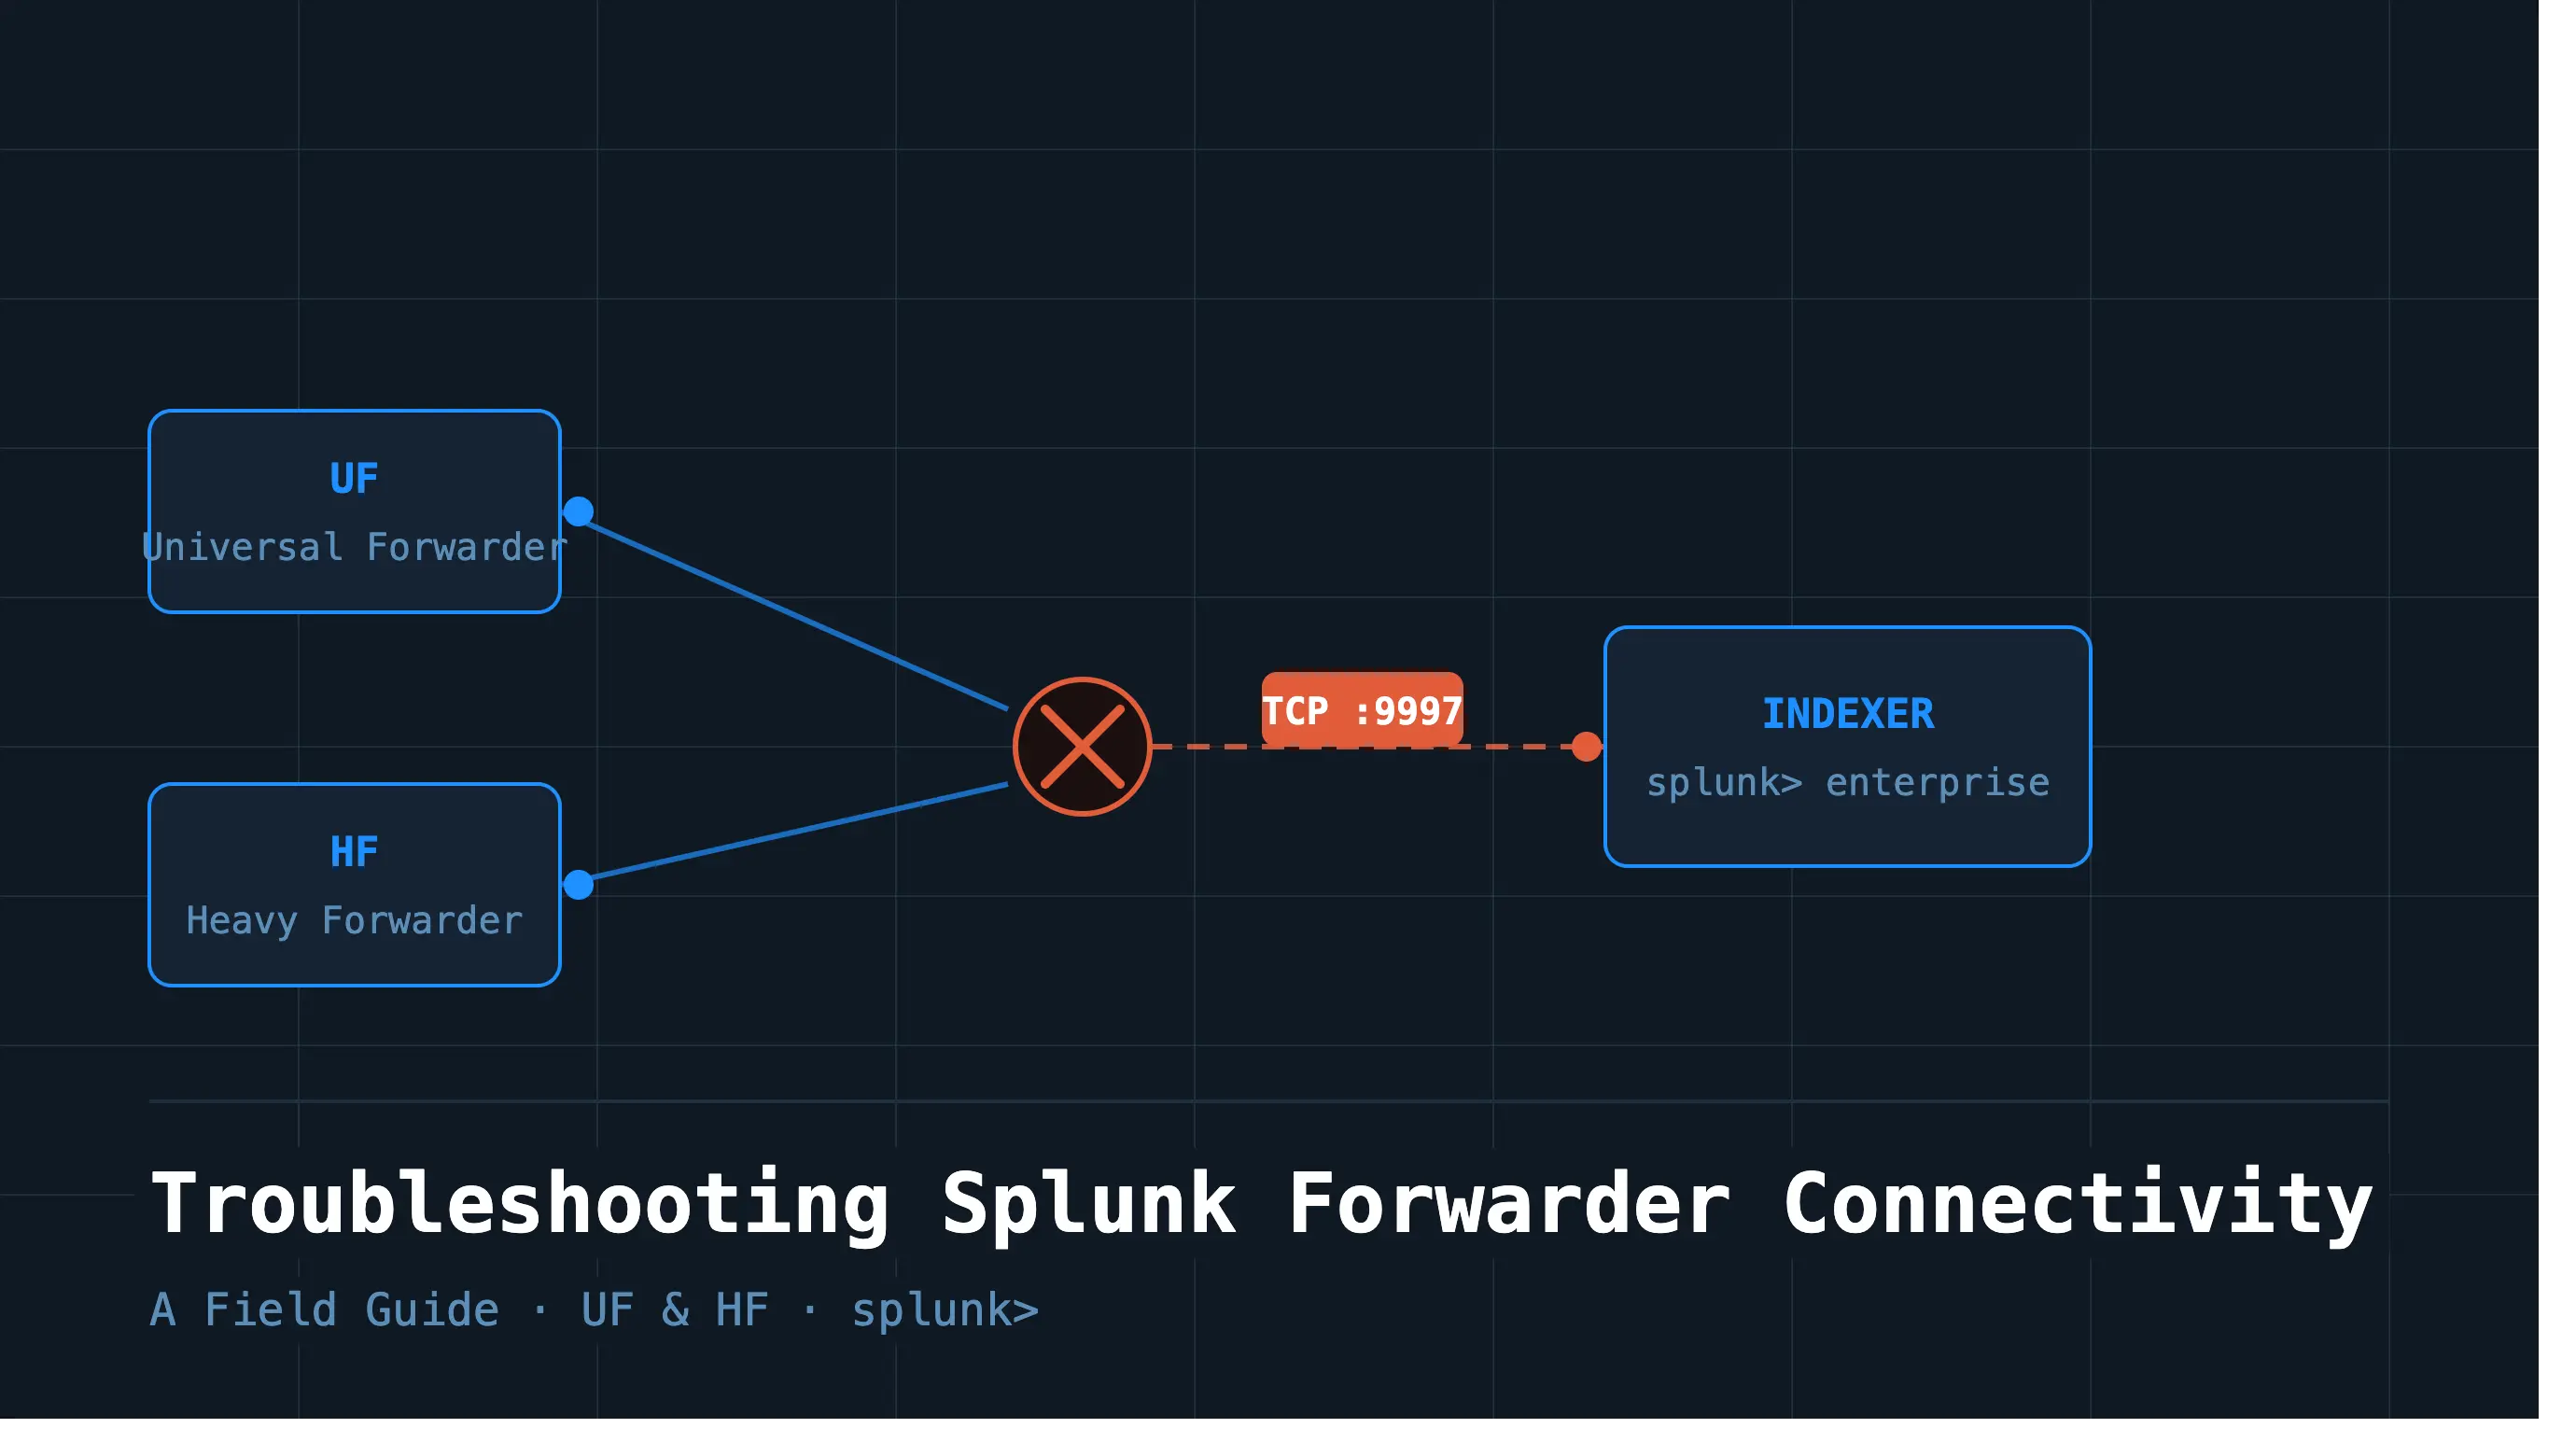
Forwarders send data to indexers over TCP using Splunk’s proprietary S2S (Splunk-to-Splunk) protocol. The receiving port must be explicitly configured on both sides — on the indexer under Forwarding and Receiving, and in outputs.conf on the forwarder. While any port can be used, 9997 is the most widely adopted convention. Here’s what happens under the hood:
- The forwarder reads
outputs.confto find the target indexer(s). - It establishes a TCP connection to the indexer on port 9997.
- If SSL is enabled, a TLS handshake occurs before any data is sent.
- Data is sent in compressed blocks. If indexer acknowledgment (indexer ack) is enabled, the forwarder waits for the indexer to confirm receipt before clearing events from its queue.
- If the connection drops, the forwarder buffers data locally (up to the configured
maxQueueSize) and retries.
Most connectivity problems will manifest in one of three places: the network path between forwarder and indexer, the TLS configuration, or outputs.conf itself.
3. The Diagnostic Toolkit
Before you start changing configurations, gather data. Here are the tools that will tell you what’s actually happening.
On the Forwarder (CLI)
Check active forward-server connections:
$SPLUNK_HOME/bin/splunk list forward-server
This shows which indexers the forwarder is aware of and whether they are currently active. If your target indexer shows as (not connected), you have a connectivity problem.
Verify your outputs configuration:
$SPLUNK_HOME/bin/splunk btool outputs list --debug
The --debug flag shows you which config file each setting is coming from — essential when you have layered configs across system/default, system/local, and apps.
Verify your inputs configuration:
$SPLUNK_HOME/bin/splunk btool inputs list --debug
Confirms what the forwarder is actually monitoring and whether stanzas are being picked up correctly.
Restart and watch the logs:
$SPLUNK_HOME/bin/splunk restart
tail -f $SPLUNK_HOME/var/log/splunk/splunkd.log
splunkd.log is your single most valuable diagnostic resource. Filter for keywords like ERROR, WARN, TcpOutputProc, and ssl.
On the Network
Test basic TCP connectivity from the forwarder to the indexer:
nc -zv <indexer_ip> 9997
# or
telnet <indexer_ip> 9997
Check active connections:
ss -tnp | grep 9997
# or
netstat -tnp | grep 9997
For deeper packet inspection, there are two legs to capture:
Leg 1 — Source device → Forwarder (is the log data actually arriving at the forwarder?):
tcpdump -i any host <source_ip> and port <source_port> -nn
The port depends on what the source device is sending on — for example 514 for syslog, 8088 for HEC, or whatever custom port your source is configured to use.
Leg 2 — Forwarder → Indexer (is the forwarder successfully sending data to the indexer?):
tcpdump -i any host <indexer_ip> and port 9997 -nn
Flag breakdown:
-i any— listens on all network interfaceshost <indexer_ip>— filters traffic to/from the indexer IP onlyport 9997— captures only Splunk S2S traffic-nn— disables DNS and port name resolution
What to look for in the output:
- SYN but no SYN-ACK → the indexer is not responding, likely a firewall issue
- SYN → SYN-ACK → ACK → TCP handshake is completing, connection is established
- No packets at all → traffic is not reaching the network interface; check the forwarder process and
outputs.conf - RST (reset) packets → connection is being actively rejected; the indexer is likely not listening on 9997
From the Splunk UI (SPL Queries)
Check for forwarder connection events:
index=_internal sourcetype=splunkd source=*splunkd.log* TcpOutputProc
| head 100
Monitor queue fill levels (useful for backpressure issues):
index=_internal sourcetype=splunk_search_messages
| search message="*queue*"
Check for data gaps from a specific host:
index=* host=<your_forwarder_hostname>
| timechart span=5m count
A flat line or gap tells you exactly when data stopped — cross-reference with splunkd.log.
4. Common Failure Scenarios & How to Fix Them
4.1 Forwarder Not Connecting at All
Symptoms: splunk list forward-server shows (not connected). No data in Splunk from this host.
Likely causes and fixes:
-
Firewall blocking port 9997. This is the #1 cause. Test with
nc -zv <indexer_ip> 9997. If it hangs or refuses, work with your network team to open the port. -
Wrong IP or hostname in
outputs.conf. Check your config:
[tcpout]
defaultGroup = my_indexers

[tcpout:my_indexers]
server = indexer_ip:9997
Make sure the IP and port are correct and that DNS resolves properly if you’re using hostnames.
- Indexer not listening on 9997. On the indexer, verify the receiving port is configured: go to Settings → Forwarding and Receiving → Configure Receiving and confirm port 9997 is enabled.
You can also check inputs.conf directly:
cat $SPLUNK_HOME/etc/system/local/inputs.conf
You should see:
[splunktcp://9997]
disabled = 0
If this stanza is missing or disabled = 1, the indexer is not listening.
4.2 Data Arriving Late or in Bursts
Symptoms: Events appear in Splunk but with significant delay, or they flood in periodically rather than continuously.
Likely causes and fixes:
- Queue backpressure. The forwarder’s output queue is full, usually because the indexer can’t keep up. Check queue metrics:
index=_internal sourcetype=splunkd component=Metrics group=queue
| eval fill_pct = current_size / max_size * 100
| stats avg(fill_pct) by name, host
If tcpout_queue or indexqueue is consistently above 80%, you have a bottleneck.
-
Network instability. Intermittent packet loss causes the forwarder to buffer and retry. Use
tcpdumpor check your network monitoring. -
useACK=truewith a slow indexer. If indexer ack is enabled and the indexer is slow to acknowledge, the forwarder stalls. Consider whether ack is truly needed for this data source.
4.3 SSL/TLS Certificate Errors
Symptoms: splunkd.log shows errors like SSL Error, certificate verify failed, or handshake failure.
Likely causes and fixes:
-
Certificate mismatch. The CN or SAN in the indexer’s certificate doesn’t match the hostname the forwarder is using to connect. Either fix the certificate or set
sslVerifyServerCert = falsetemporarily for testing (never in production). -
Expired certificate. Check the certificate expiry:
openssl x509 -in <cert_file> -noout -dates
-
CA not trusted. If you’re using a self-signed or internal CA, ensure
sslRootCAPathinoutputs.confpoints to the correct CA bundle. -
TLS version mismatch. Older UFs may not support TLS 1.2+. Check
sslVersionsin bothoutputs.confand the indexer’sinputs.conf.
4.4 outputs.conf Misconfiguration
Symptoms: Forwarder starts but never connects, or connects to the wrong indexer.
This is more common than you’d think, especially in environments with multiple apps deploying their own outputs.conf. Remember: Splunk merges all outputs.conf files it finds, and conflicts can produce unexpected behavior.
Always use btool to see the merged result:
$SPLUNK_HOME/bin/splunk btool outputs list --debug
Common mistakes:
- Specifying
indexAndForward = trueon a UF (this field is ignored on UFs — only HFs support local indexing) - Using
[tcpout-server://<ip>:<port>]stanzas inconsistently withdefaultGroup - Forgetting to set
disabled = falseon the tcpout stanza
4.5 Forwarder Connects But Data Isn’t Indexed
Symptoms: splunk list forward-server shows the indexer as active. The connection exists. But data doesn’t appear in Splunk.
This is where UF and HF diverge significantly.
For UF: The problem is almost always on the receiving end — a parsing issue, a missing sourcetype, or the data landing in an unexpected index. Check:
index=* host=<your_forwarder_hostname> earliest=-15m
Try index=* broadly first to rule out an index mismatch.
For HF: The issue may be in the local pipeline — a transforms.conf dropping events, a props.conf misconfiguration causing parsing to fail, or a routing issue sending data to nullQueue. Check:
index=_internal sourcetype=splunkd component=Metrics group=pipeline
| stats sum(cpu_seconds) by processor, host
Also check for null routing in transforms.conf:
[drop_these_events]
DEST_KEY = queue
FORMAT = nullQueue
If a transform like this is accidentally matching your data, events will be silently dropped.
5. UF-Specific vs. HF-Specific Issues
Universal Forwarder
The UF’s biggest limitation in troubleshooting is that it gives you very little visibility into what it’s doing with your data. It doesn’t parse, it doesn’t index locally, and it doesn’t expose a web UI. You’re largely flying blind.
Key UF-specific tips:
- Always use
btoolandsplunkd.log— they’re your only windows into what’s happening. - The UF’s internal queue size defaults are quite small. In high-throughput environments, consider tuning
maxQueueSizeinoutputs.conf. - File monitoring (
monitor://) stanzas can silently stop if the file hasn’t changed or if the CRC seed check fails. Checkfishbucketstate if old logs aren’t being re-ingested:
$SPLUNK_HOME/bin/splunk cmd btprobe -d \
  $SPLUNK_HOME/var/lib/splunk/fishbucket/splunk_private_db --file <path_to_monitor>
Heavy Forwarder
The HF is a full Splunk instance, which means it has more moving parts — and more ways to fail.
Key HF-specific tips:
- Monitor the HF’s own resource usage. If it’s CPU or memory constrained, the pipeline will back up, causing data delay or loss.
props.confandtransforms.conferrors on an HF can silently mangle or drop data before it ever reaches the indexer. Always test parsing changes withsplunk cmd searchtransformer.- If the HF is also running saved searches or dashboards (a configuration that should generally be avoided), those compete with the forwarding pipeline for resources.
- Use the Monitoring Console on the HF itself (if licensed) to track pipeline queues and CPU usage per component.
6. A Practical Troubleshooting Checklist
Work top to bottom — most issues are caught in the first few steps.
Step 1 — Is the forwarder process running?
$SPLUNK_HOME/bin/splunk status
Step 2 — Can the forwarder reach the indexer on port 9997?
nc -zv <indexer_ip> 9997
Step 3 — Is the indexer configured to receive data? Check Settings → Forwarding and Receiving → Configure Receiving in the Splunk UI.
Step 4 — What does list forward-server say?
$SPLUNK_HOME/bin/splunk list forward-server
Step 5 — What does btool say about your outputs config?
$SPLUNK_HOME/bin/splunk btool outputs list --debug
Step 6 — Are there errors in splunkd.log?
grep -i "error\|ssl\|tcpoutput" $SPLUNK_HOME/var/log/splunk/splunkd.log | tail -50
Step 7 — Is data landing in Splunk at all (possibly wrong index)?
index=* host=<forwarder_hostname> earliest=-15m
Step 8 (HF only) — Is the local pipeline healthy?
Check queue fill levels and look for null routing in transforms.conf.
Step 9 — Is SSL the issue? Temporarily disable SSL (in a lab environment) to confirm. Check certificate validity and CA trust chain.
Step 10 — Are there firewall or proxy devices in the path?
Use tcpdump on both sides to confirm packets are actually arriving at the indexer.
7. Conclusion
Forwarder connectivity issues rarely stem from a single obscure bug — most of the time, it’s a firewall rule, a typo in outputs.conf, or a certificate that quietly expired three weeks ago. The key is having a systematic approach: understand the communication flow, trust splunkd.log and btool over assumptions, and verify each layer before moving to the next.
A few proactive habits can save you from most of these headaches in the first place:
- Use the Splunk Monitoring Console to set alerts on forwarder queue fill levels before they become problems.
- Keep certificate expiry dates in your team’s calendar.
- Use a deployment server to manage
outputs.confcentrally rather than touching forwarders individually. - Regularly run
splunk list forward-serveras a quick health check across your fleet.
Happy troubleshooting — and may your queues always be empty.