The Problem: Too Many Alerts, Too Little Context
Security operations teams running Splunk Enterprise Security are no strangers to alert fatigue. A high-severity notable fires, and an analyst immediately begins a familiar sequence: pivot on the source IP, search for related authentication failures, check the asset’s risk score, correlate with other events, and eventually piece together a finding. Done well, this produces a clear picture of root cause, IOCs, and recommended actions. Done under pressure, with dozens of notables competing for attention, investigations often become inconsistent and time-consuming.
The challenge isn’t access to data. It’s turning that data into context. Splunk Enterprise Security already provides the telemetry analysts need, but building a complete investigation still requires connecting evidence from multiple searches, knowledge objects, and contextual data sources. That process depends on knowing which questions to ask, where to look, and how to interpret the results-structured, repeatable steps that are well suited to an AI agent.
Why MCP and a Local LLM?
The Splunk MCP Server add-on exposes Splunk capabilities as callable tools through MCP. Rather than writing custom REST wrappers for every investigation task, the agent discovers and invokes tools such as splunk_run_query directly. Splunk authentication and RBAC still apply: the agent can only do what its token allows.
Running the model locally with Ollama keeps event data inside your environment. The n8n workflow uses Ollama’s OpenAI-compatible /v1 API so the LangChain-style agent in n8n can issue MCP tool calls through a standard chat-completions interface.
We used qwen2.5:7b for this lab because it produced reliable structured tool calls in our testing. Smaller variants such as qwen2.5:3b may work in some setups, but end-to-end validation here was done with the 7B model. Models that print tool intent as plain text instead of issuing function calls will hit the diagnostic path described later.
For an introduction to the Model Context Protocol (MCP) and how Splunk implements it, see Bridging LLMs and Operational Data with MCP Using Splunk.
What We’re Building: From Notable to Triage Report
In this post, we’ll build a reproducible lab that automatically turns a Splunk Enterprise Security notable into a structured triage report. When a notable is generated, Splunk sends it to an n8n webhook. An AI agent running a local model through Ollama then invokes Splunk MCP Server tools to investigate the alert and returns a report summarizing root cause, IOCs, and recommended actions.
| Component | Role |
|---|---|
| Splunk ES + Splunk MCP Server add-on | Provides notables and investigation tools (splunk_run_query, and related splunk_* tools) |
| n8n (Docker) | Orchestrates webhook handling and AI agent execution |
Ollama + qwen2.5:7b |
Runs the local LLM used for MCP tool calling |
| Lab correlation search | Generates a synthetic VPN brute-force notable for testing |
The complete project is available on GitHub: splunk-agentic-triage
Figure 1 shows the end-to-end path from a Splunk ES notable to a triage report (or a diagnostic response when tool calls fail).
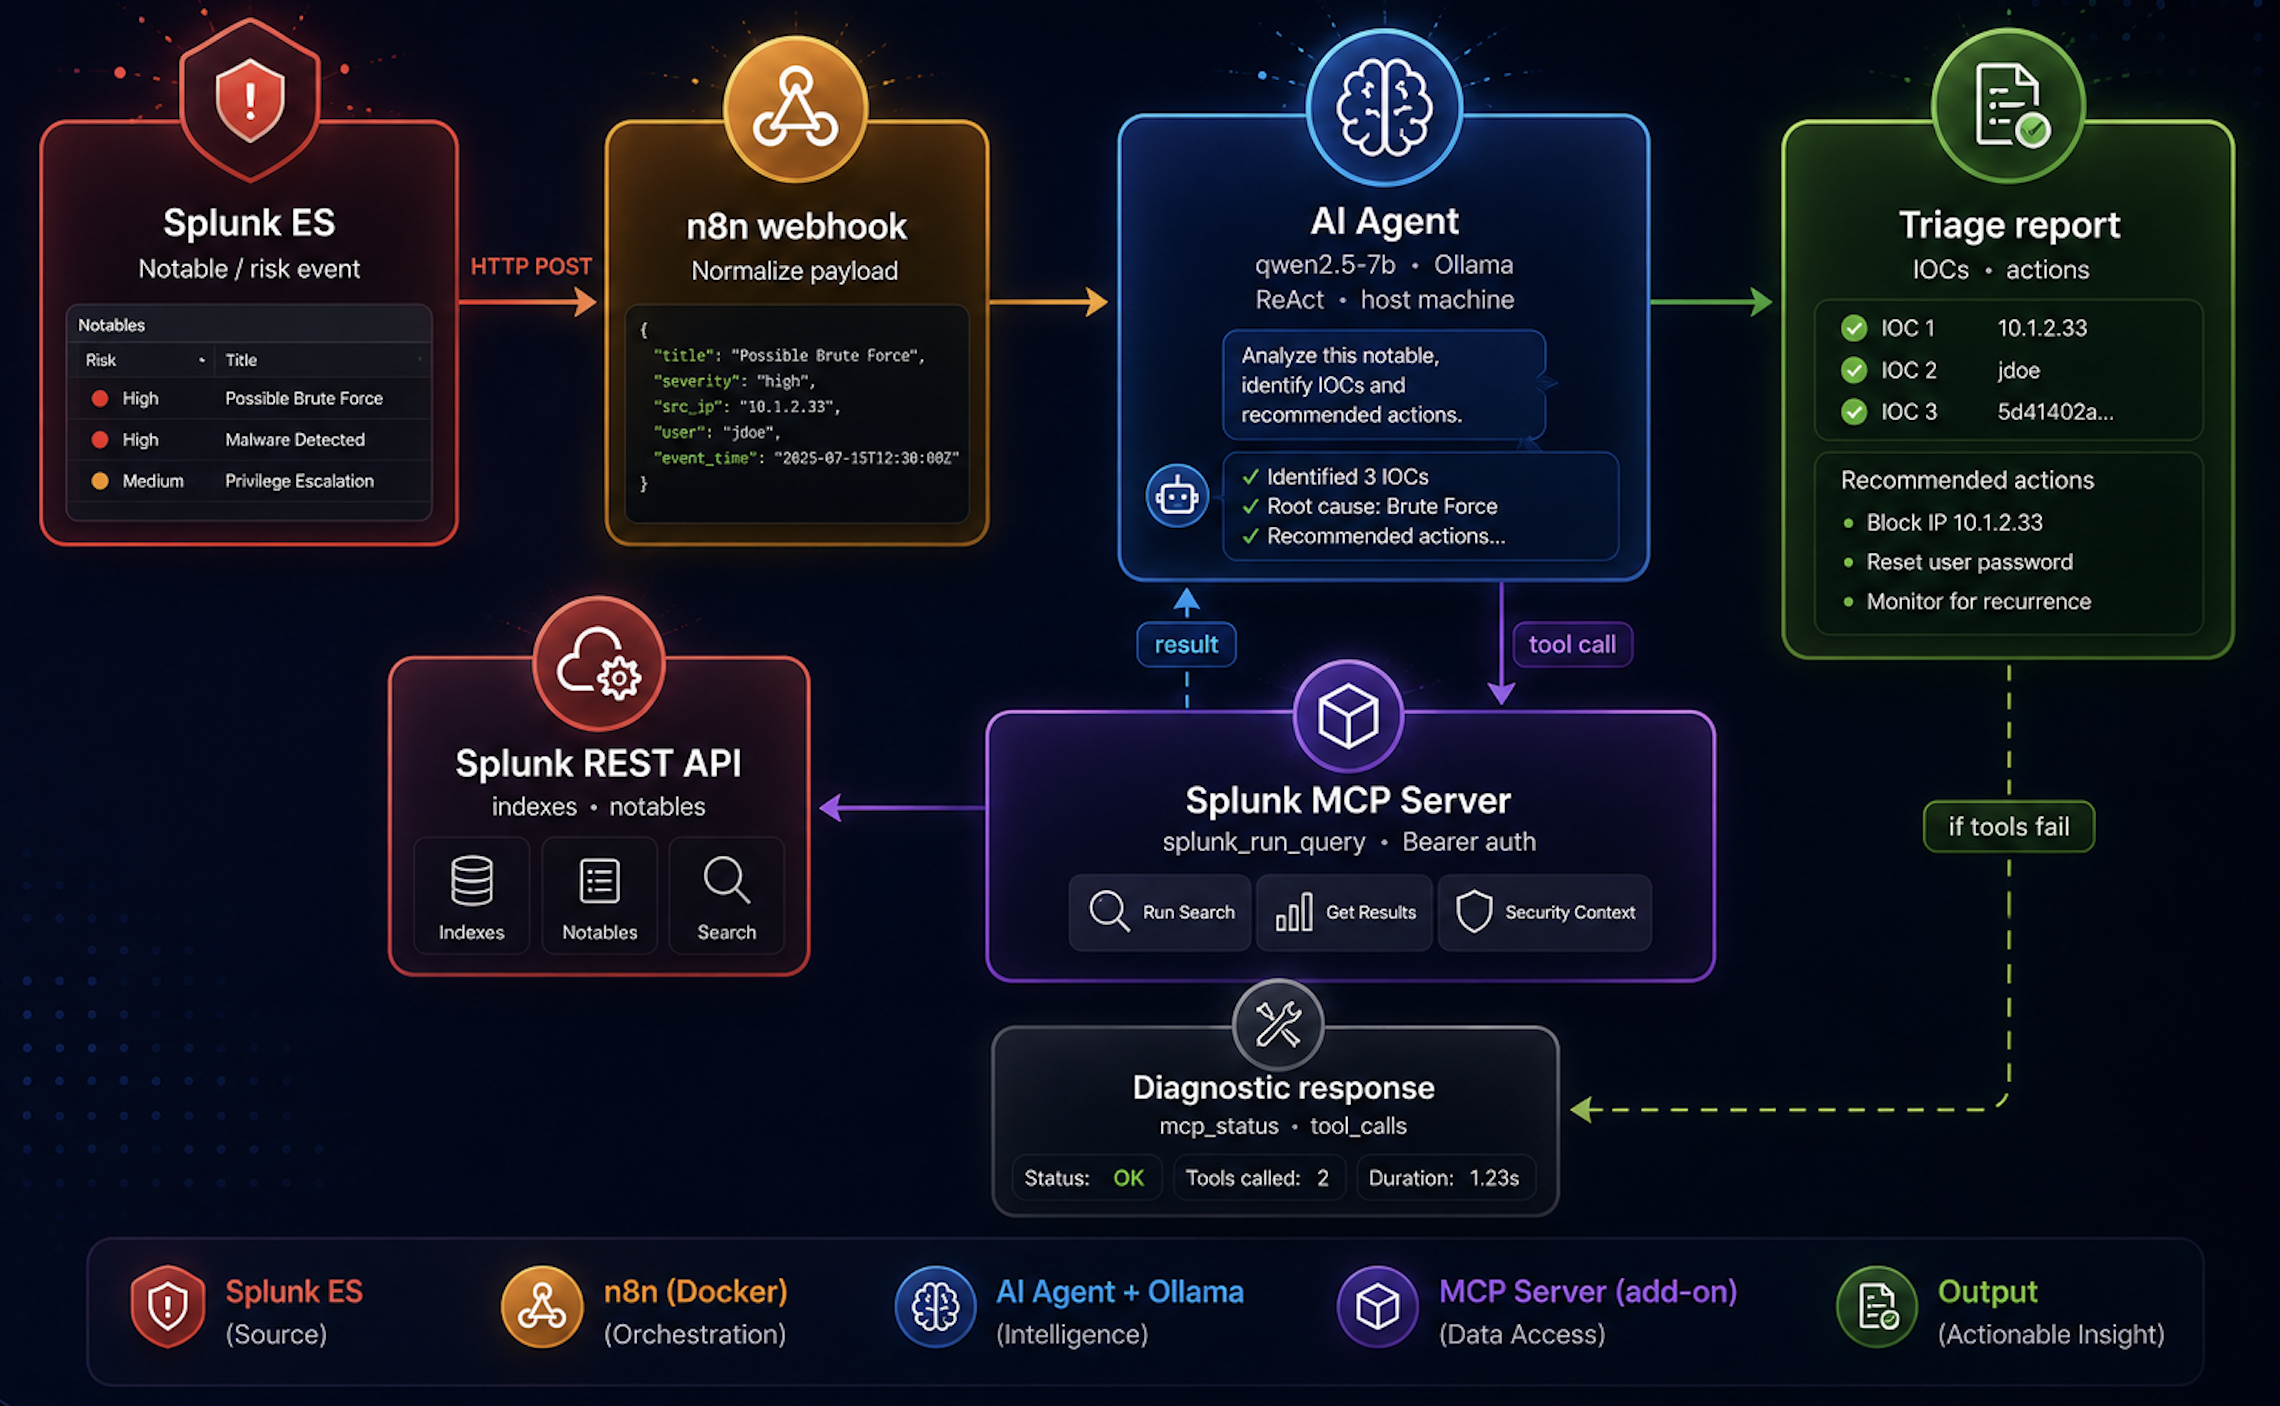
Figure 1. ES notable → n8n webhook → AI agent (Ollama) → Splunk MCP tools → triage report or diagnostics (illustrative sample values)
When a notable is generated in Splunk ES, an alert action POSTs the event to an n8n webhook. A Normalize Payload node standardizes incoming fields from both Splunk’s webhook action and direct curl requests, ensuring that the rest of the workflow always receives a consistent schema. The AI Agent node then uses qwen2.5:7b via Ollama to analyze the event and invoke Splunk MCP tools, without custom Splunk REST wrappers.
The agent talks to the Splunk MCP Server over streamable HTTP with an encrypted authorization token. It uses tools such as splunk_run_query to pull related events, risk context, and notable details. After enough context is gathered, it emits a structured triage report. If an MCP call fails, Debug Agent Output and Diagnose MCP & Parse Report surface diagnostics instead of letting the failure pass unnoticed.
The Lab Scenario: A Simulated VPN Brute-Force Attack
To demonstrate the workflow without production data, the lab ships a self-contained Splunk app under splunk/agentic_triage_test/. It uses | makeresults to synthesize a VPN brute-force detection, so the demo does not depend on indexed authentication logs.
The correlation search simulates 12 consecutive failed VPN authentications from one external IP against one user account over roughly four minutes, then aggregates them into a single notable with investigation context: source IP, destination user, failed-attempt count, failure reasons, MITRE technique, risk score, and recommended actions.
| Field | Lab value |
|---|---|
| Notable title | Brute Force Detected: jsmith from 203.0.113.87 |
src_ip |
203.0.113.87 |
dest_user / dest |
jsmith / corp-vpn-gw01.internal.example |
failed_attempts |
12 |
attack_type |
password_spray_brute_force |
mitre_technique |
T1110.001 (Password Guessing) |
| Schedule | Every 5 minutes |
Once the search runs, the notable appears in the Splunk ES Analyst Queue like any other detection. The configured alert action then forwards the notable to the n8n webhook.
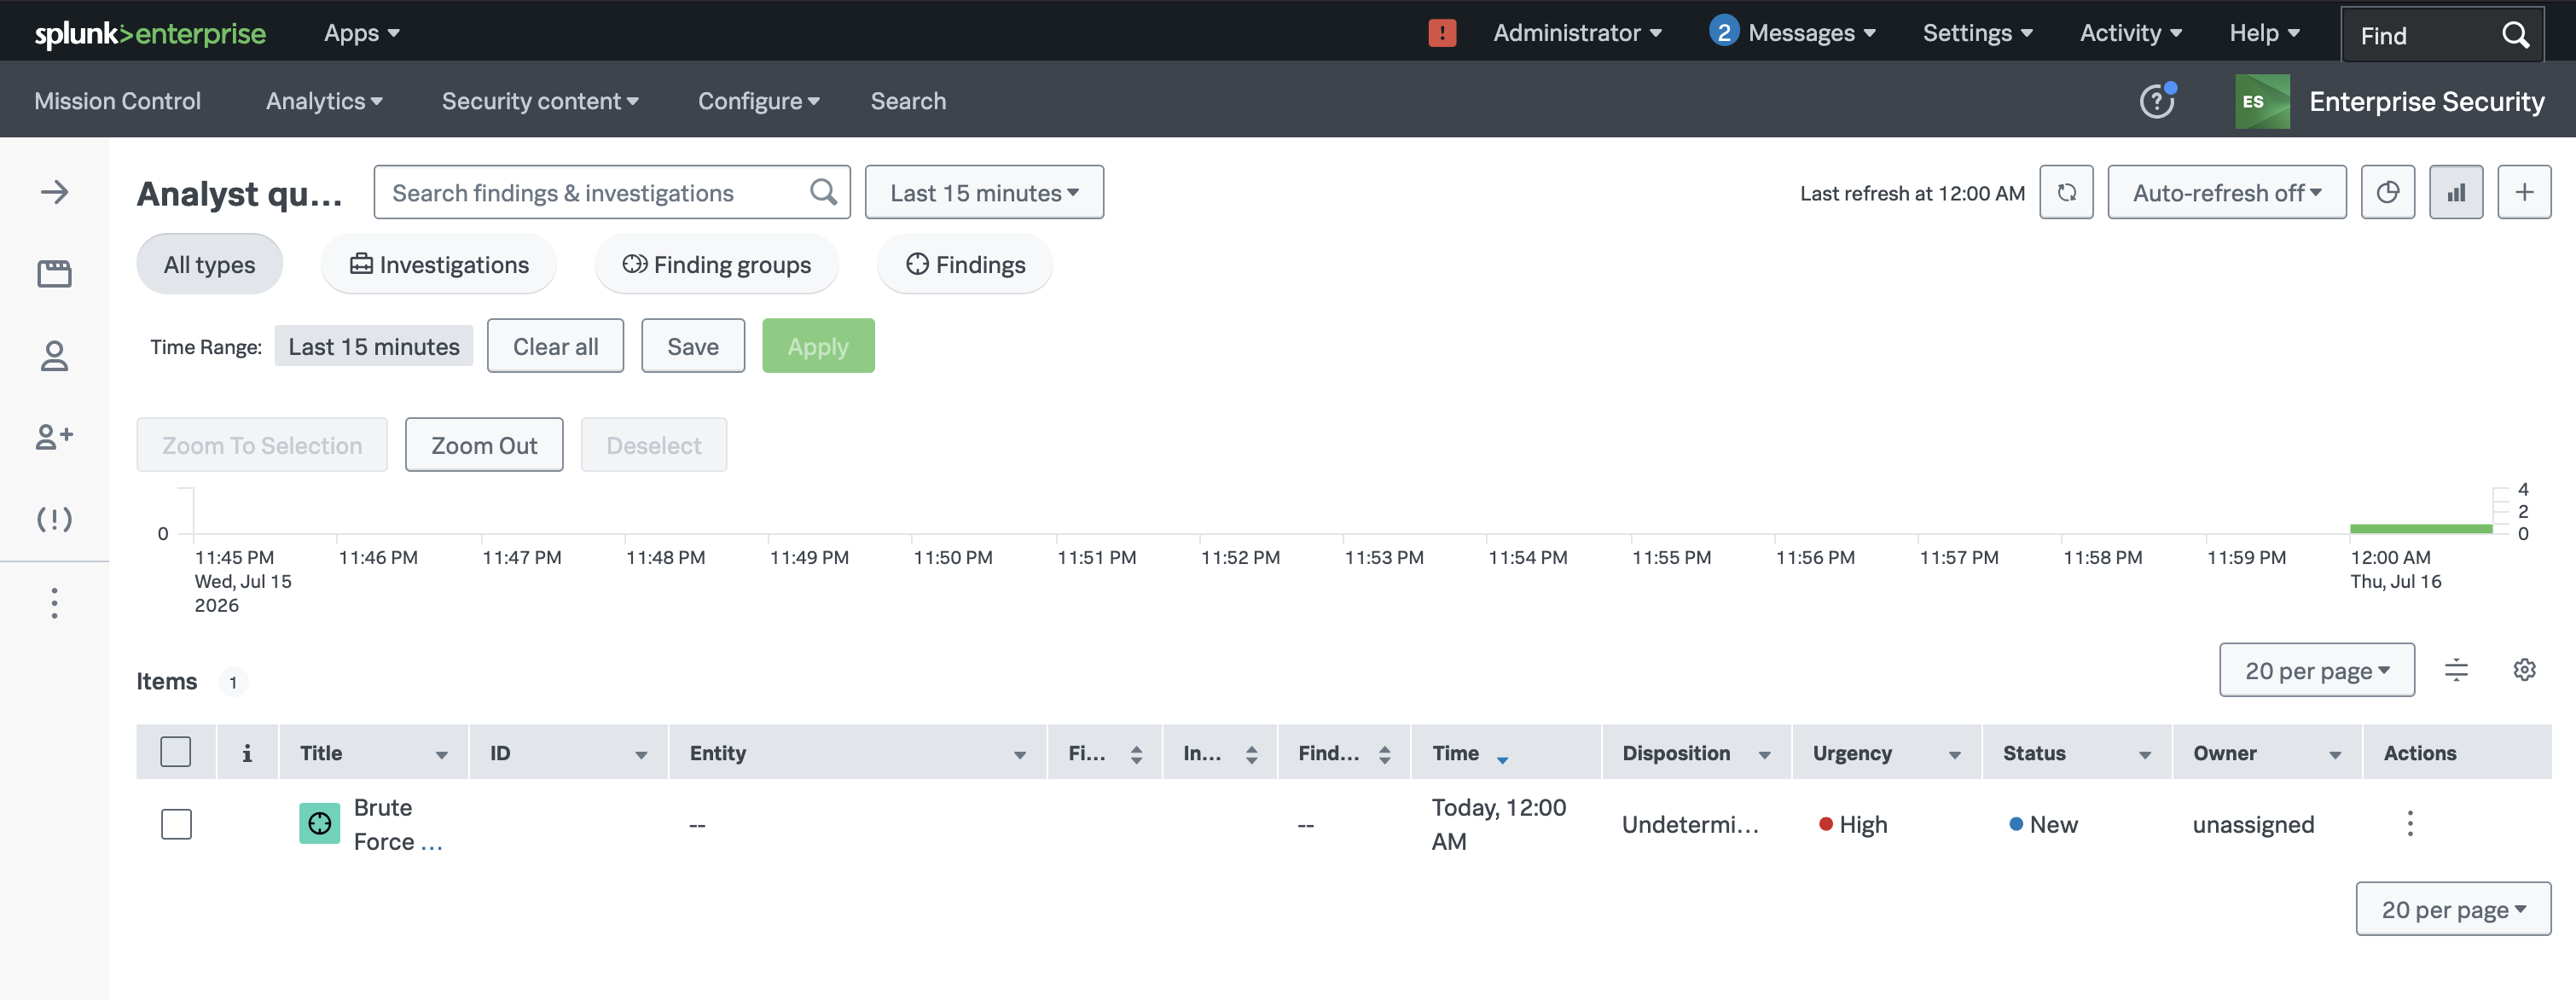
Figure 2. Simulated VPN brute-force finding in the Splunk ES Analyst Queue
Setting Up the Stack
The environment comes up in a few steps. The sections below cover prerequisites and the configuration needed to reproduce the workflow.
⚠️ Lab environment only. These examples use simplified authentication and an open webhook for clarity. Before production use, harden authentication, enable proper TLS validation, and protect exposed endpoints. See Securing the Agent for Production.
Prerequisites
- Splunk Enterprise Security with the Splunk MCP Server add-on installed
- An encrypted MCP encrypted authorization token from the Splunk MCP Server app (not a generic Settings → Tokens API token)
- Docker Desktop (or equivalent) for n8n
- Ollama on the host with
qwen2.5:7bpulled
1. Connect Splunk MCP Server
Install the Splunk MCP Server add-on from Splunkbase, create an encrypted MCP token in the app’s settings, and note the endpoint (typically https://your-splunk-host/services/mcp). Use this endpoint as the value for SPLUNK_MCP_ENDPOINT in .env.
Official docs: About MCP Server for Splunk Platform
2. Run Ollama on the Host
Ollama runs on the host rather than inside Docker so it can use local GPU or CPU resources. The n8n container reaches it at http://host.docker.internal:11434.
ollama pull qwen2.5:7b
curl -s http://127.0.0.1:11434/api/tags
If the service is not already running:
ollama serve
3. Start n8n with Compose
cp .env.example .env
# Set SPLUNK_MCP_ENDPOINT and SPLUNK_TOKEN
docker compose up -d
On startup, entrypoint.sh imports credentials, loads the workflow if it is not already present, activates it, and registers the webhook. When the container is healthy, the endpoint is http://localhost:5678/webhook/splunk.
4. Install the Lab Correlation Rule
Install the lab app and restart Splunk:
cp -R splunk/agentic_triage_test $SPLUNK_HOME/etc/apps/
$SPLUNK_HOME/bin/splunk restart
Then confirm the correlation search is enabled in ES Content Management and that its webhook action points to http://your-n8n-host:5678/webhook/splunk.
Running the Workflow End-to-End
With the stack running, wait for the scheduled lab correlation search (every five minutes). It creates the synthetic VPN brute-force notable in Splunk ES and fires the webhook; n8n starts the investigation as soon as the POST arrives.
You can also inspect the raw event in Search:
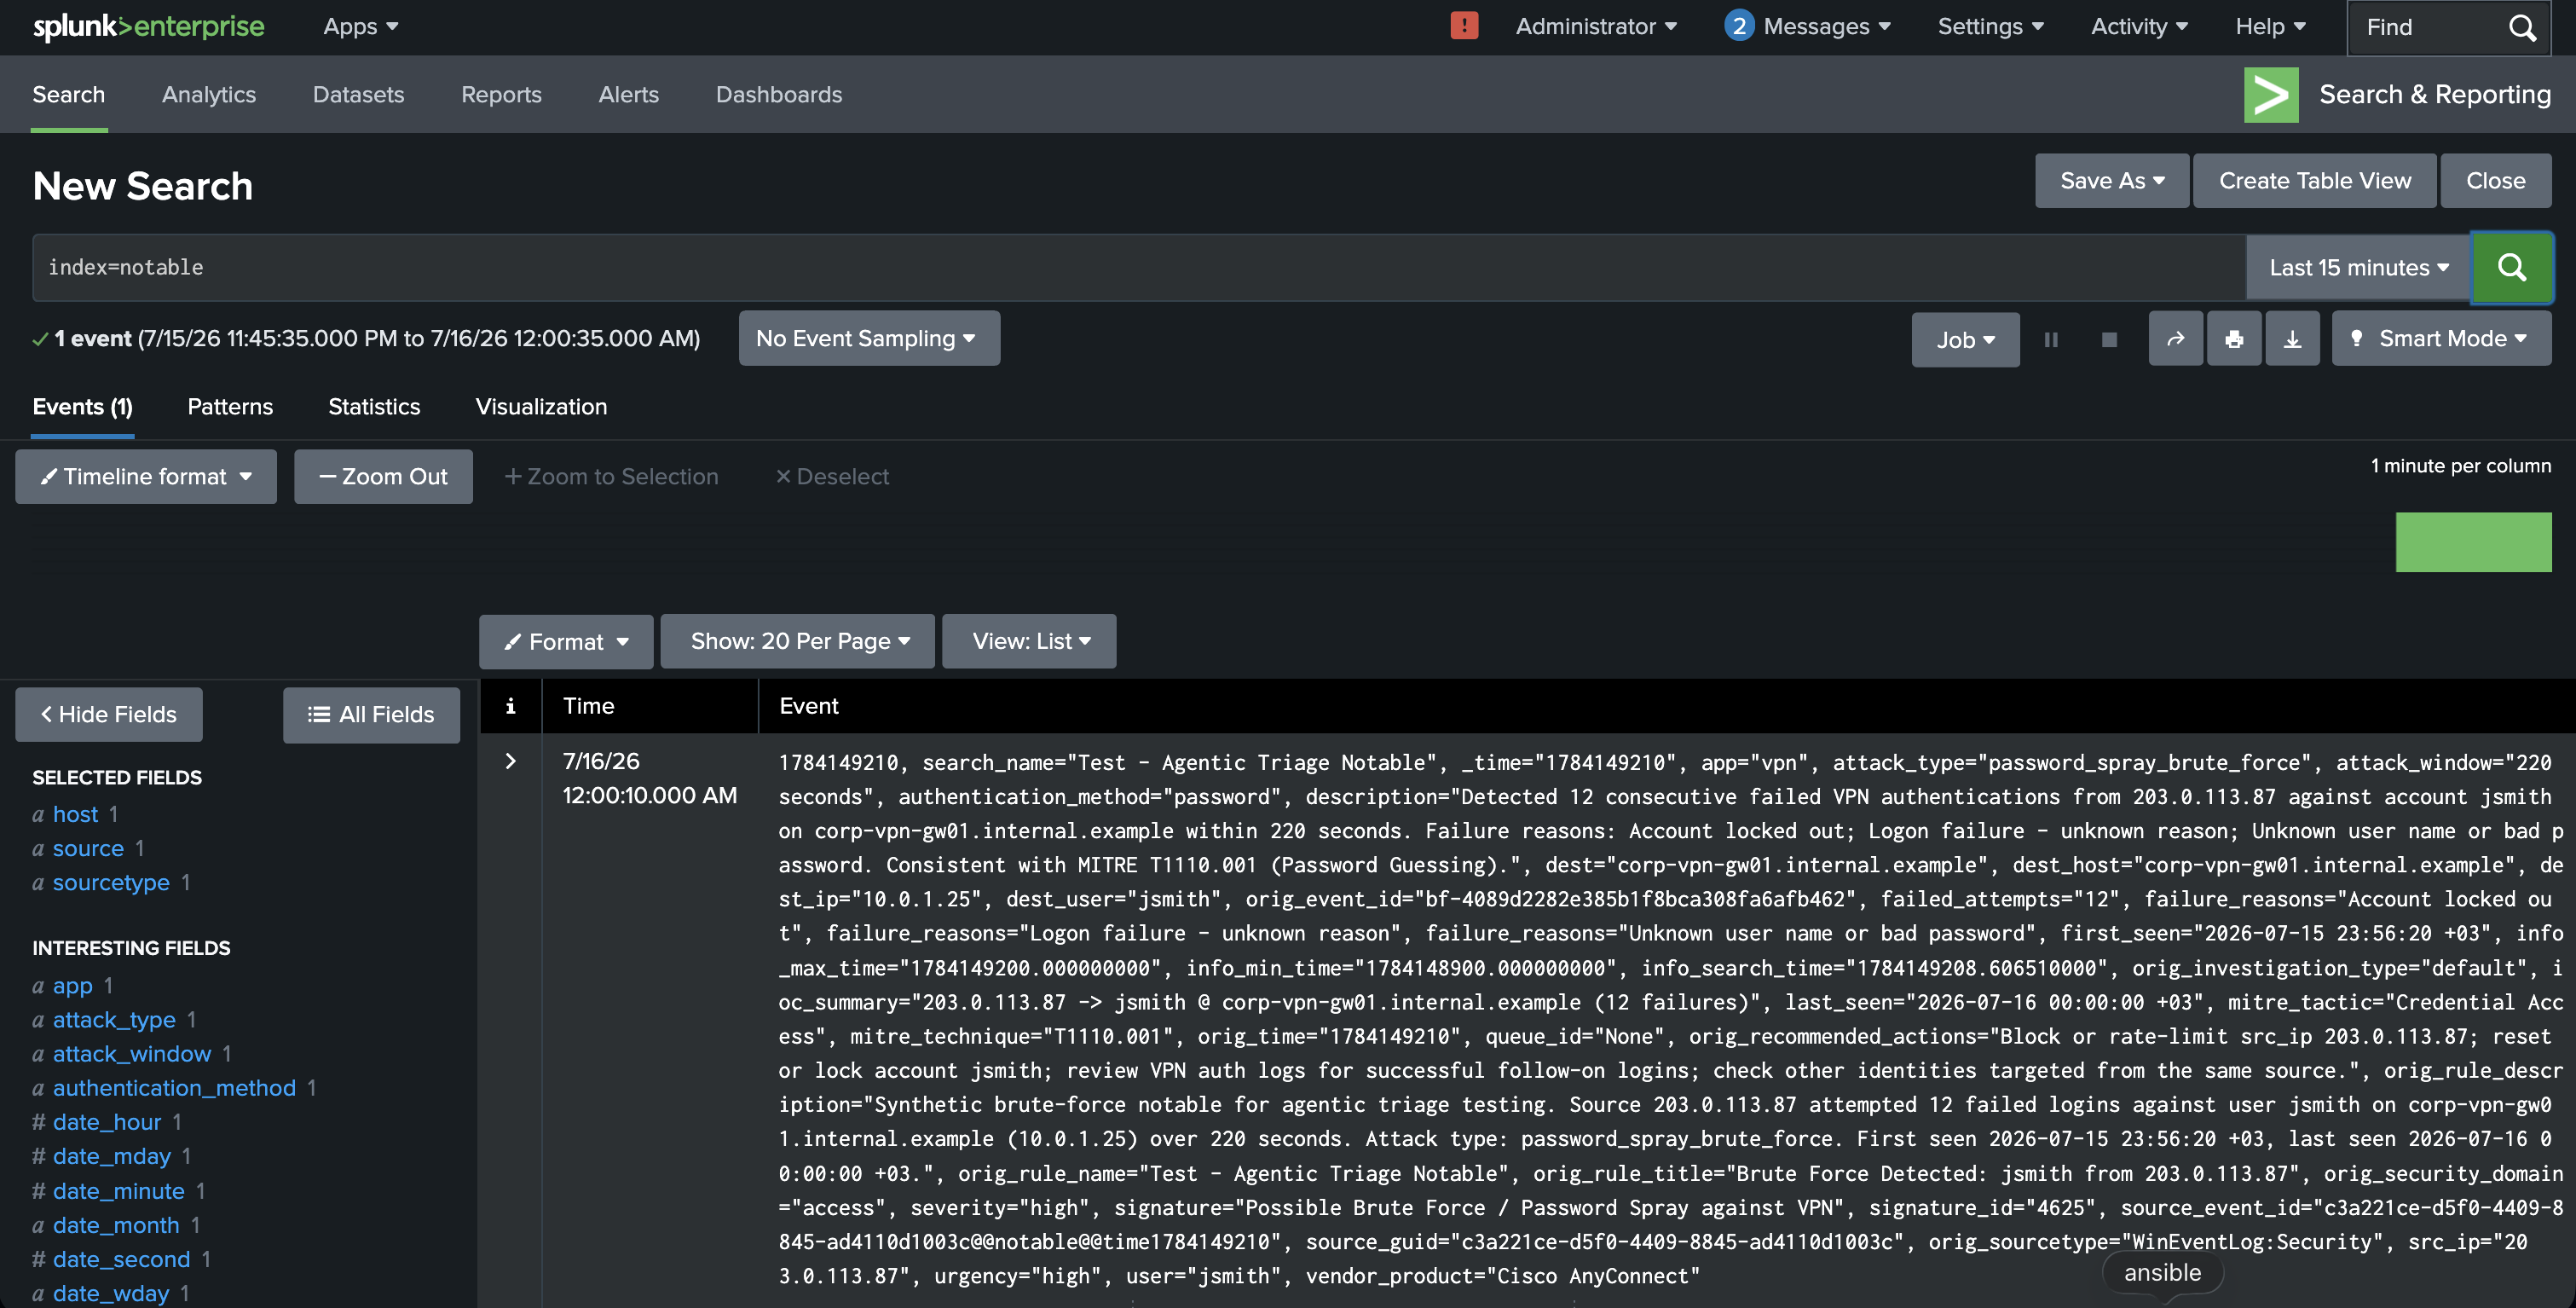
Figure 3. Lab notable event returned by `index=notable` (Search & Reporting), including MITRE fields and recommended actions
In n8n, open Executions to watch the agent invoke MCP tools and produce the triage report:
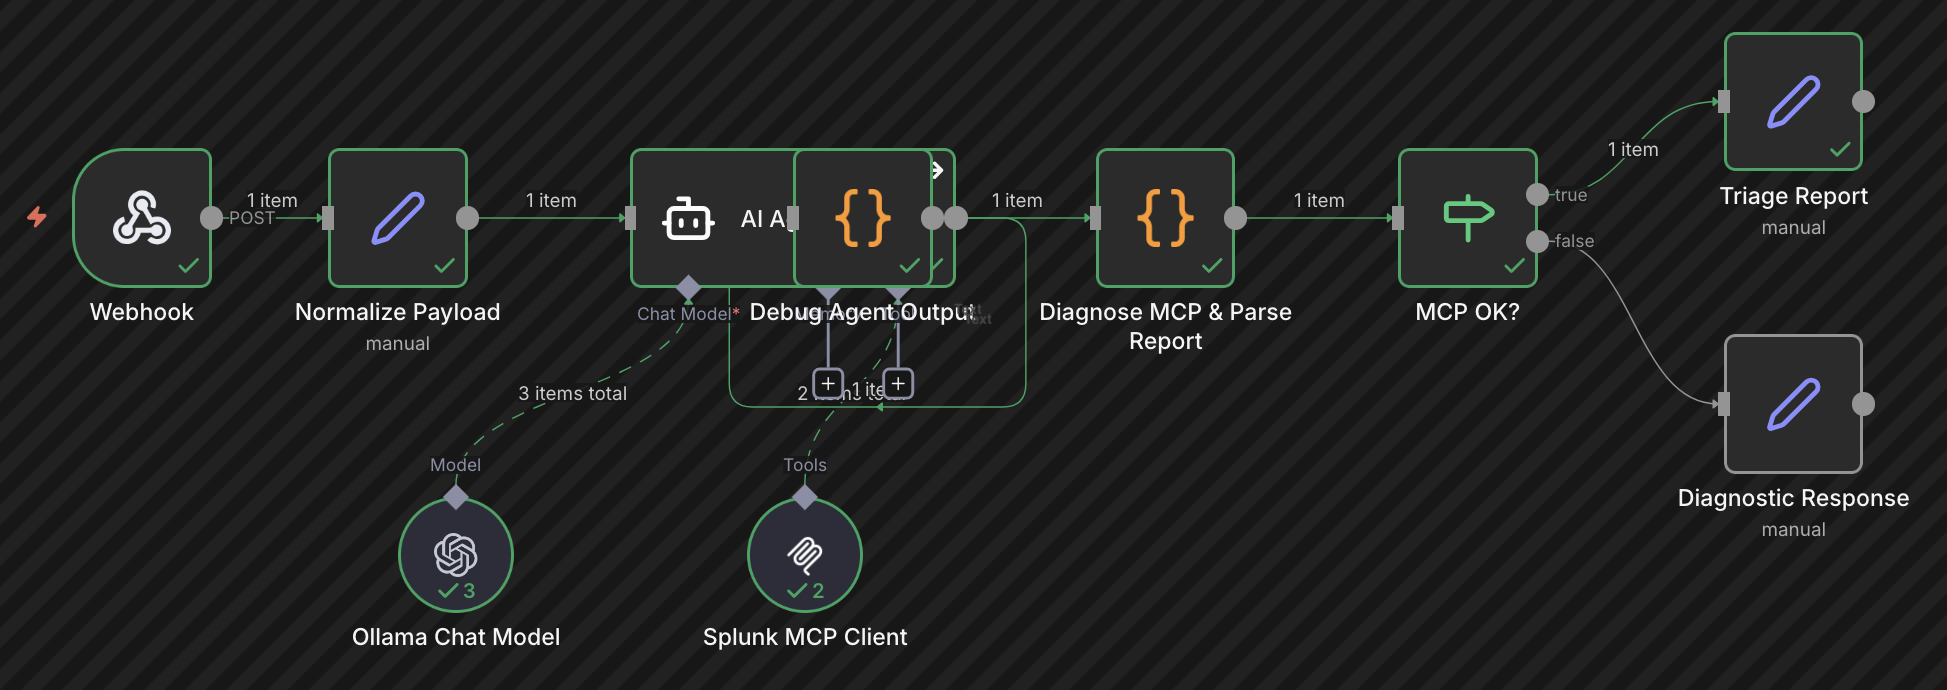
Figure 4. n8n workflow: Webhook → Normalize Payload → AI Agent (Ollama + Splunk MCP Client) → Diagnose → Triage Report or Diagnostic Response
A successful run returns structured fields such as severity, recommended actions, and a narrative raw_report:
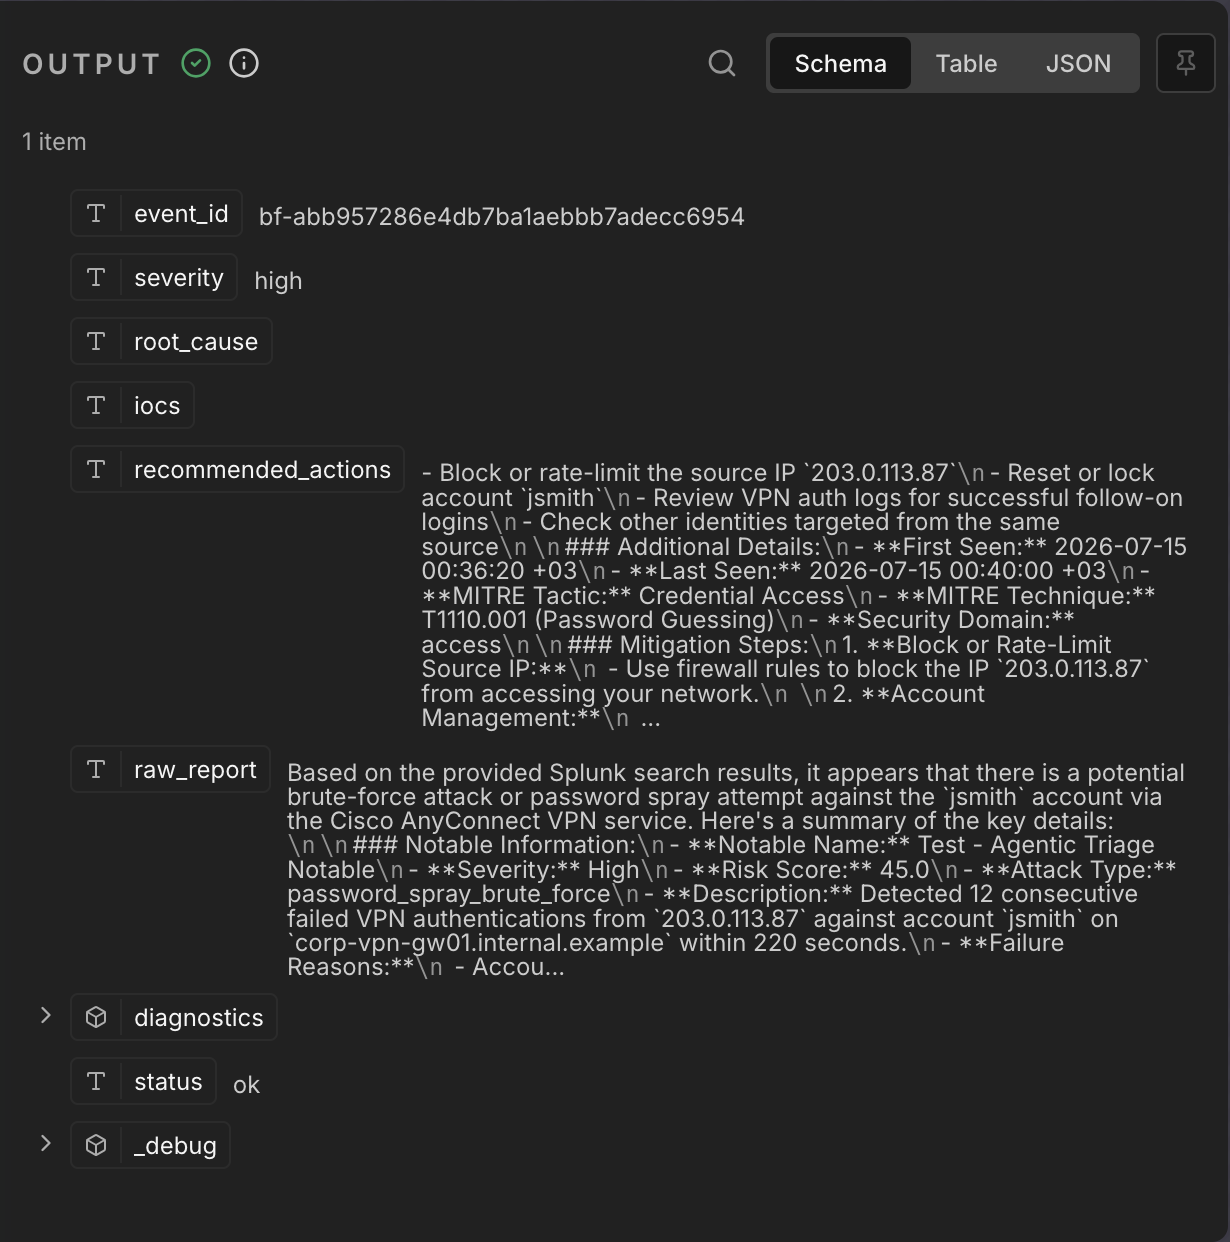
Figure 5. Triage report output (`status: ok`), with recommended actions populated from the notable context
The Splunk MCP Server dashboard confirms that the agent issued splunk_run_query calls during the investigation:
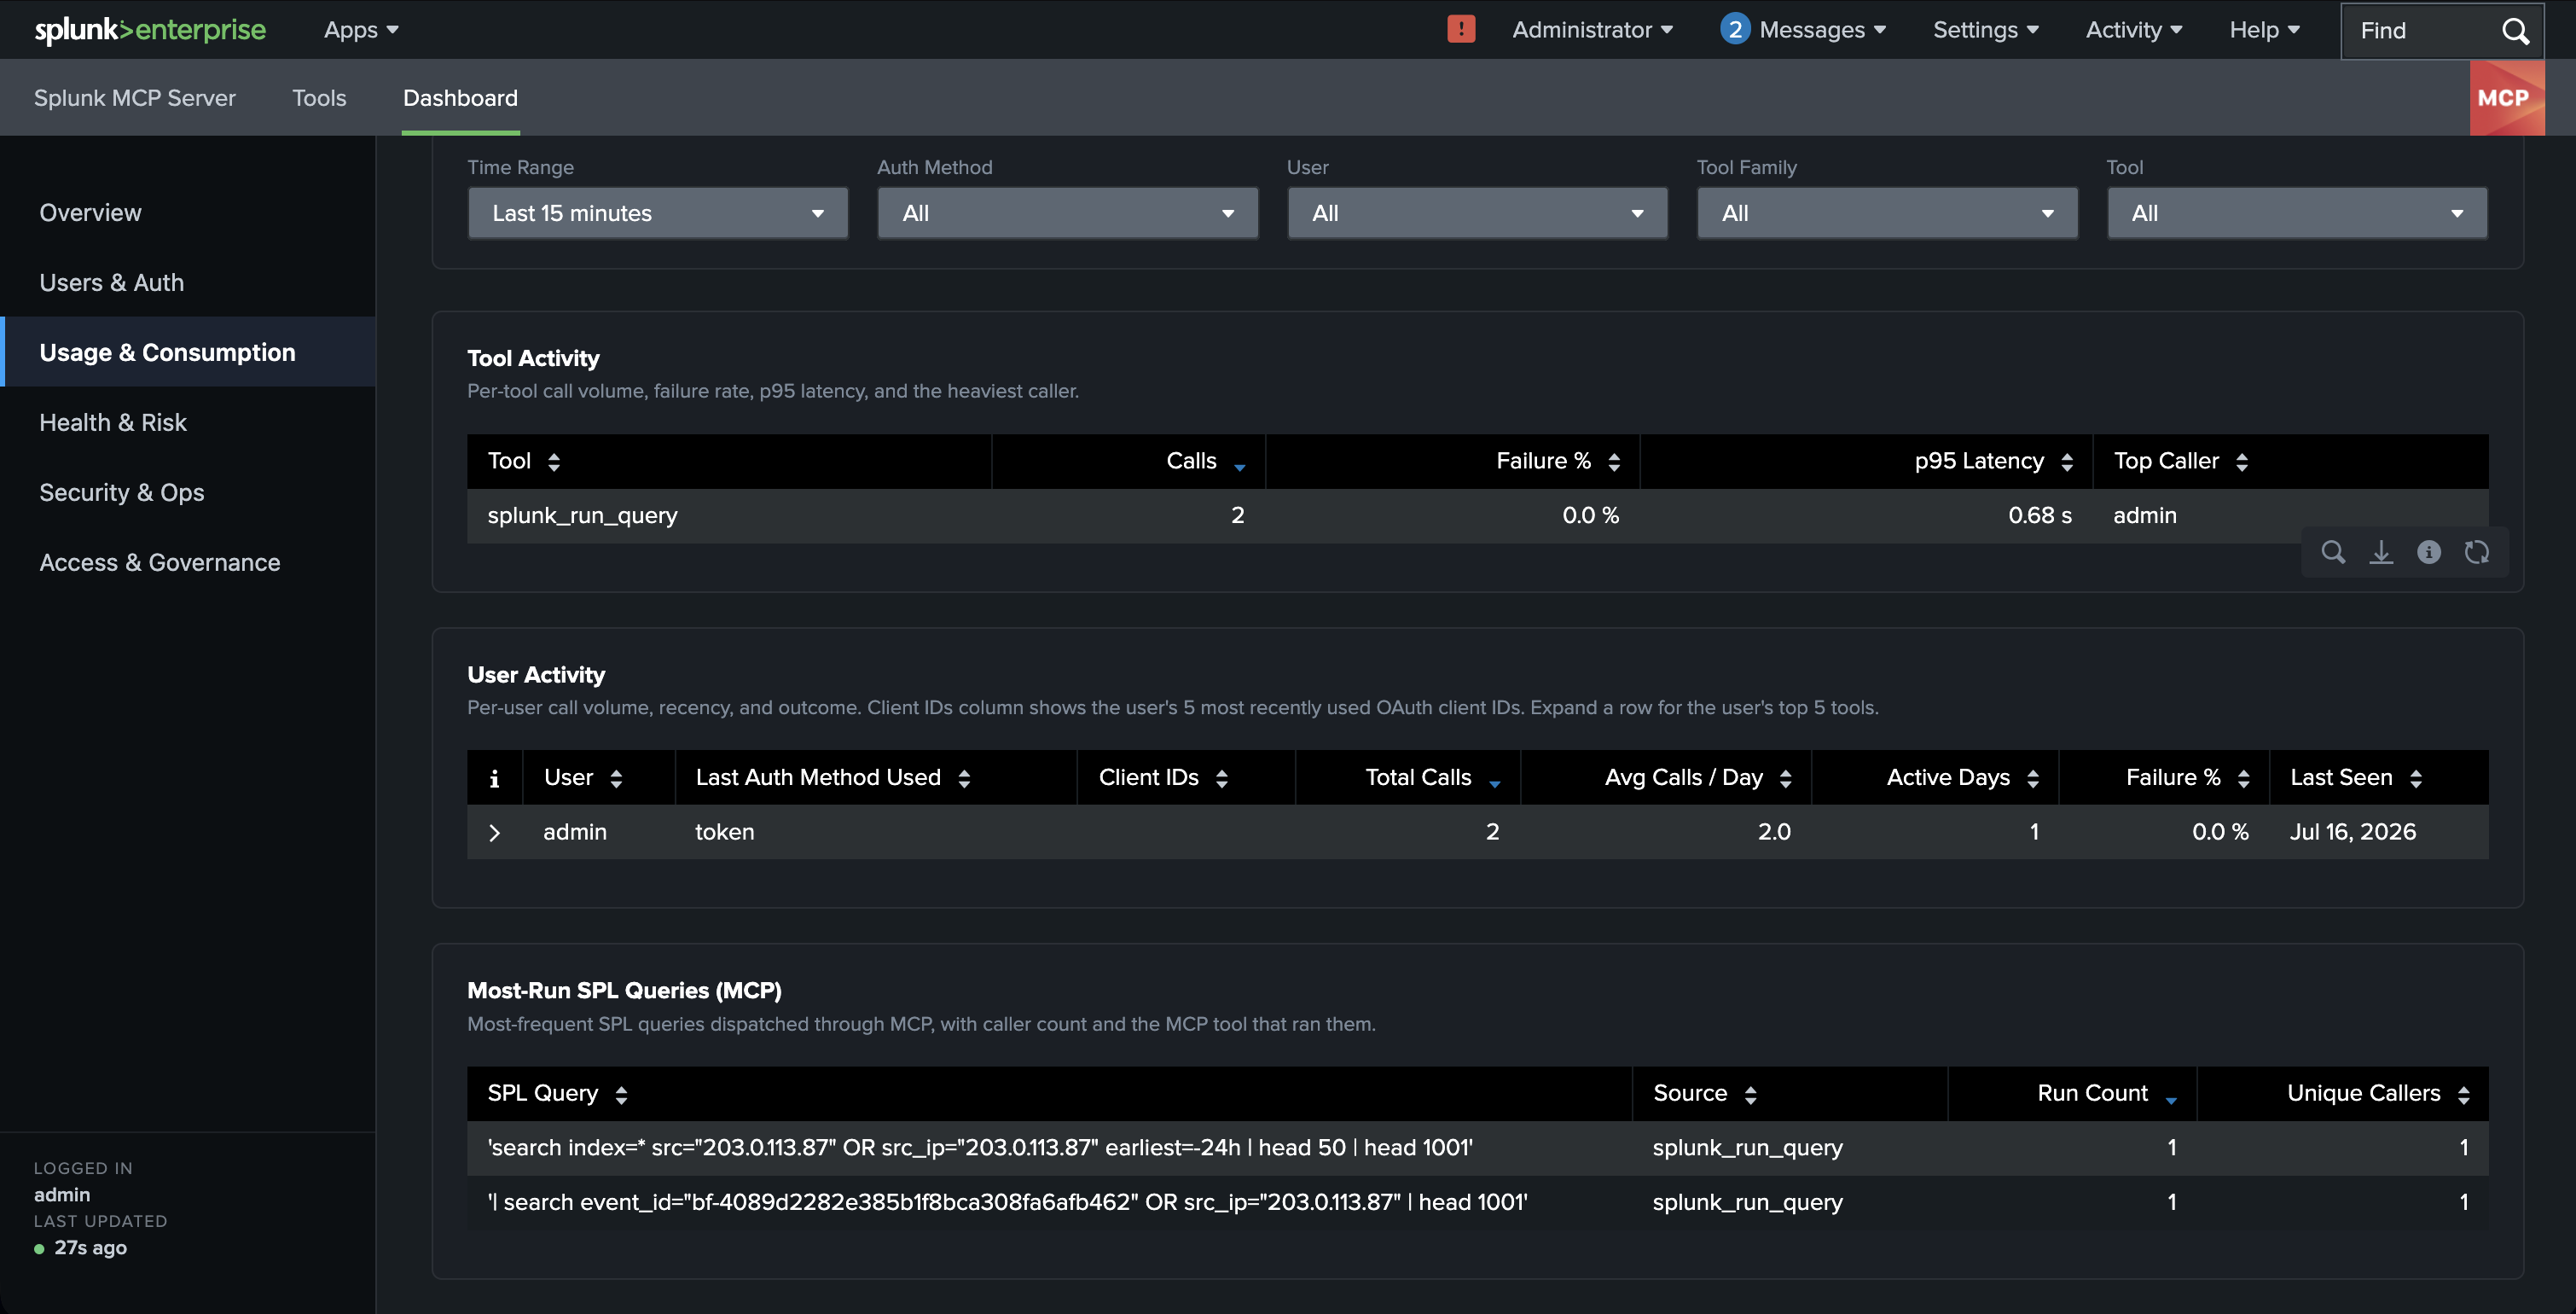
Figure 6. Splunk MCP Server Usage & Consumption: `splunk_run_query` activity and the SPL queries issued for `203.0.113.87`
Because this lab synthesizes the notable with | makeresults and does not index matching authentication logs, fields such as root_cause and iocs may remain empty even when the workflow succeeds. With real indexed data behind a production correlation search, those fields would typically be filled from related events returned by MCP tool calls.
When Things Go Wrong: Debugging Tool Calls
If the agent finishes without calling any tools, the workflow routes to Diagnostic Response instead of Triage Report. A completed run with no MCP tool calls is treated as a failed investigation, not a success.
Two nodes provide visibility:
| Node | Purpose |
|---|---|
| Debug Agent Output | Logs the full agent output, including intermediateSteps, to the n8n container logs |
| Diagnose MCP & Parse Report | Evaluates tool execution, sets diagnostics.mcp_status, and routes the workflow |
Check the logs with:
docker logs n8n 2>&1 | grep -A 50 'AI Agent DEBUG'
The diagnostics.mcp_status field indicates what happened:
| Status | Meaning | What to check |
|---|---|---|
tools_called_ok |
Investigation completed with successful tool use | — |
no_tool_calls |
The model completed without invoking MCP tools | Model, prompt, MCP tool binding |
tools_requested_but_not_executed |
Tool use appeared as text instead of function calls | Model compatibility; OpenAI-compatible /v1 endpoint |
tools_called_with_errors |
Tools ran but returned errors | MCP endpoint, encrypted authorization token, Splunk connectivity from the container |
In our testing, the most common failure mode was tools_requested_but_not_executed. Using qwen2.5:7b through Ollama’s OpenAI-compatible /v1 API consistently produced structured function calls. If the MCP client reports connection errors, confirm that SPLUNK_MCP_ENDPOINT is reachable from the n8n container. For lab environments that use Splunk’s self-signed certificate, NODE_TLS_REJECT_UNAUTHORIZED=0 may be required. Replace this shortcut before production (see below).
Securing the Agent for Production
The Splunk MCP Server inherits Splunk authentication and RBAC, so the agent can only perform actions allowed by its token. Associate the MCP token with a dedicated Splunk role that can read only the indexes required for investigation. Most triage workflows need the notable and risk indexes, along with the log indexes behind your correlation searches. Restricting the token to those indexes reduces data exposure, and capabilities such as admin_all_objects or indexes_edit should be avoided.
MCP guardrails complement RBAC. The Splunk MCP Server add-on exposes operational controls such as request rate limits, tool execution timeouts, and default query row limits through its settings pages. These limits apply per tool call rather than across an entire investigation, making RBAC the primary control over what the agent can access, while MCP guardrails limit how those permissions can be exercised.
The lab shortcuts that make this workflow easy to reproduce are not appropriate for live security data. Before adopting this pattern in production, consider the following changes.
| Lab choice | Production direction |
|---|---|
NODE_TLS_REJECT_UNAUTHORIZED=0 |
Trust Splunk’s CA via NODE_EXTRA_CA_CERTS, or use a properly signed certificate |
| Open webhook endpoint | Restrict access with network controls, authentication, or an approved API gateway |
MCP encrypted authorization token in .env |
Store secrets in a secrets manager; bind the token to a least-privilege Splunk role |
| Ollama on a developer machine | Run inference on a managed on-premises platform with appropriate access controls |
Synthetic makeresults rule |
Point the webhook at production correlation searches; remove the lab app |
Treat the AI-generated triage report as analyst assistance rather than an authoritative decision. Review the findings and recommended actions before triggering incident response or SOAR automation.
Although this example focuses on VPN brute-force detections, the same architecture applies to many other investigation scenarios. Risk-based detections are a natural extension, with the risk index often serving as the primary investigation source. Other scenarios, such as lateral movement or data exfiltration, can benefit from prompts tailored to the investigation process analysts already follow.
The structured triage output can also integrate with downstream systems such as SOAR platforms, case management solutions, or ticketing systems. As you move toward production, refining the system prompt and limiting agent iterations can help reduce unnecessary tool calls while keeping investigations focused.
We hope this walkthrough provides a practical starting point for building AI-assisted investigation workflows with Splunk Enterprise Security, n8n, Ollama, and the Splunk MCP Server.