From Kafka to Splunk with OpenTelemetry Collector Contrib
A follow-up to the Windows Event Logs → Kafka series — this time, we ditch the connector and go full OTel.
Now, if you have been following all my posts, you already have an idea of shipping Windows Event Logs to Kafka via Splunk UF + S2S Kafka Connector, and streaming logs from Kafka to Splunk via Splunk Sink Connector. In the third post, I briefly covered the OpenTelemetry Collector Contrib component with Splunk Edge.
The goal of today’s post is to connect the two dots: consume from Kafka with otelcol-contrib and send the data to Splunk via HEC. Modern, clean and as Splunk themselves state in their SOC4Kafka repo:
“it serves as a replacement for the existing Splunk Connect for Kafka (kafka-connect-splunk)”
That’s right, it is the new way. So let’s do it.
Architecture
Kafka Topic
    └── otelcol-contrib (kafka receiver)
            └── resourcedetection processor
                    └── splunk_hec exporter
                            └── Splunk Index
Basic Pipeline. Without any connectors. Without any issues regarding JVM.
Requirements
- Working Splunk environment with:
- HEC token
- An index (in this blog we’ll use
kafka_otel)
- Kafka 3.7 and above (Confluent 7.9.0 in KRaft mode is being used in this example)
otelcol-contrib
Step 1: Kafka Setup (KRaft Mode)
We are using a Kafka broker running on a single node in KRaft mode without any use of ZooKeeper.
Download Confluent Platform 7.9.0 or any Kafka 3.7+ release and place the configuration as broker_and_controller.properties:
############################# Server Basics #############################

process.roles=broker,controller
node.id=1
controller.quorum.voters=1@localhost:9093

############################# Socket Server Settings #############################

listeners=PLAINTEXT://:9092,CONTROLLER://:9093
advertised.listeners=PLAINTEXT://localhost:9092
inter.broker.listener.name=PLAINTEXT
controller.listener.names=CONTROLLER
listener.security.protocol.map=CONTROLLER:PLAINTEXT,PLAINTEXT:PLAINTEXT,SSL:SSL,SASL_PLAINTEXT:SASL_PLAINTEXT,SASL_SSL:SASL_SSL
num.network.threads=3
num.io.threads=8
socket.send.buffer.bytes=102400
socket.receive.buffer.bytes=102400
socket.request.max.bytes=104857600

############################# Log Basics #############################

log.dirs=/tmp/kafka-logs
num.partitions=1
num.recovery.threads.per.data.dir=1

############################# Internal Topic Settings  #############################

offsets.topic.replication.factor=1
transaction.state.log.replication.factor=1
transaction.state.log.min.isr=1

############################# Log Retention Policy #############################

log.retention.hours=168
log.segment.bytes=1073741824
log.retention.check.interval.ms=300000

############################# Group Coordinator Settings #############################

group.initial.rebalance.delay.ms=0

############################# Confluent Settings  #############################

confluent.license.topic.replication.factor=1
confluent.metadata.topic.replication.factor=1
confluent.security.event.logger.exporter.kafka.topic.replicas=1
confluent.balancer.enable=true
confluent.balancer.topic.replication.factor=1
Note: Make sure
log.dirspoints to an appropriate location on your computer.
Format the storage and start the broker:
bin/kafka-storage format -t $(bin/kafka-storage random-uuid) -c broker_and_controller.properties
bin/kafka-server-start broker_and_controller.properties
Create a topic:
bin/kafka-topics --bootstrap-server localhost:9092 \
  --create --topic otel-kafka-test
You can verify it’s working with a quick producer/consumer pair:
# Producer
bin/kafka-console-producer --bootstrap-server localhost:9092 --topic otel-kafka-test

# Consumer (separate terminal)
bin/kafka-console-consumer --bootstrap-server localhost:9092 --topic otel-kafka-test
Step 2: Install otelcol-contrib
macOS (arm64):
curl -L -o otelcol-contrib.tar.gz \
  "https://github.com/open-telemetry/opentelemetry-collector-releases/releases/download/v0.154.0/otelcol-contrib_0.154.0_darwin_arm64.tar.gz"

tar -xzf otelcol-contrib.tar.gz
Linux: Check out the previous post — we’ve done it before.
Check it runs:
./otelcol-contrib --version
Step 3: Configure the Pipeline
This is where the magic lives. Save this as kafka-to-splunk.yaml:
receivers:
  kafka:
    brokers: ["localhost:9092"]
    logs:
      topics:
        - otel-kafka-test
      encoding: "text"

processors:
  resourcedetection:
    detectors: ["system"]
    system:
      hostname_sources: ["os"]

exporters:
  splunk_hec:
    token: <your-hec-token>
    endpoint: "https://<splunk-host>:8088/services/collector"
    source: kafka:otel
    sourcetype: kafka:otel
    index: kafka_otel
    tls:
      insecure_skip_verify: true
    splunk_app_name: "soc4kafka"
    sending_queue:
      enabled: true
      num_consumers: 10
      queue_size: 10000
      block_on_overflow: true
      sizer: items
      batch:
        min_size: 1000

service:
  pipelines:
    logs:
      receivers: [kafka]
      processors: [resourcedetection]
      exporters: [splunk_hec]
Things to note:
-
receivers.kafka— pollsotel-kafka-testtopic from your local broker.encoding: "text"implies that it receives raw string data, not anything with protobuf shenanigans going on. -
processors.resourcedetection- discovers resource information and adds it to each event. That’s why you’ll findos.type = darwin(orlinux) tags added to your Splunk events. -
exporters.splunk_hec- sends to Splunk through HEC. Configuration ofsending_queuewithbatchis production-grade: it buffers up to 10k events and sends batches of 1000 records. But it won’t harm your local test to have that much configuration anyway.
Don’t forget: using
insecure_skip_verify: trueis acceptable during local development, but should be replaced with proper SSL certificates in production.
Step 4: Splunk — HEC Token & Index
In Splunk:
- Index creation:
kafka_otel - Create HEC Token: Settings -> Data Inputs -> HTTP Event Collector -> New Token
- Allocate this to the
kafka_otelindex - Paste the token in
kafka-to-splunk.yaml -
Nice to have:
kafka:otelsourcetype
- Allocate this to the
Step 5: Run & Verify
Start the collector:
./otelcol-contrib --config kafka-to-splunk.yaml
You will notice that the Kafka receiver gets connected and starts consuming messages. It’s now time to send a sample message:
bin/kafka-console-producer --bootstrap-server localhost:9092 --topic otel-kafka-test
> Hello from Kafka side!!
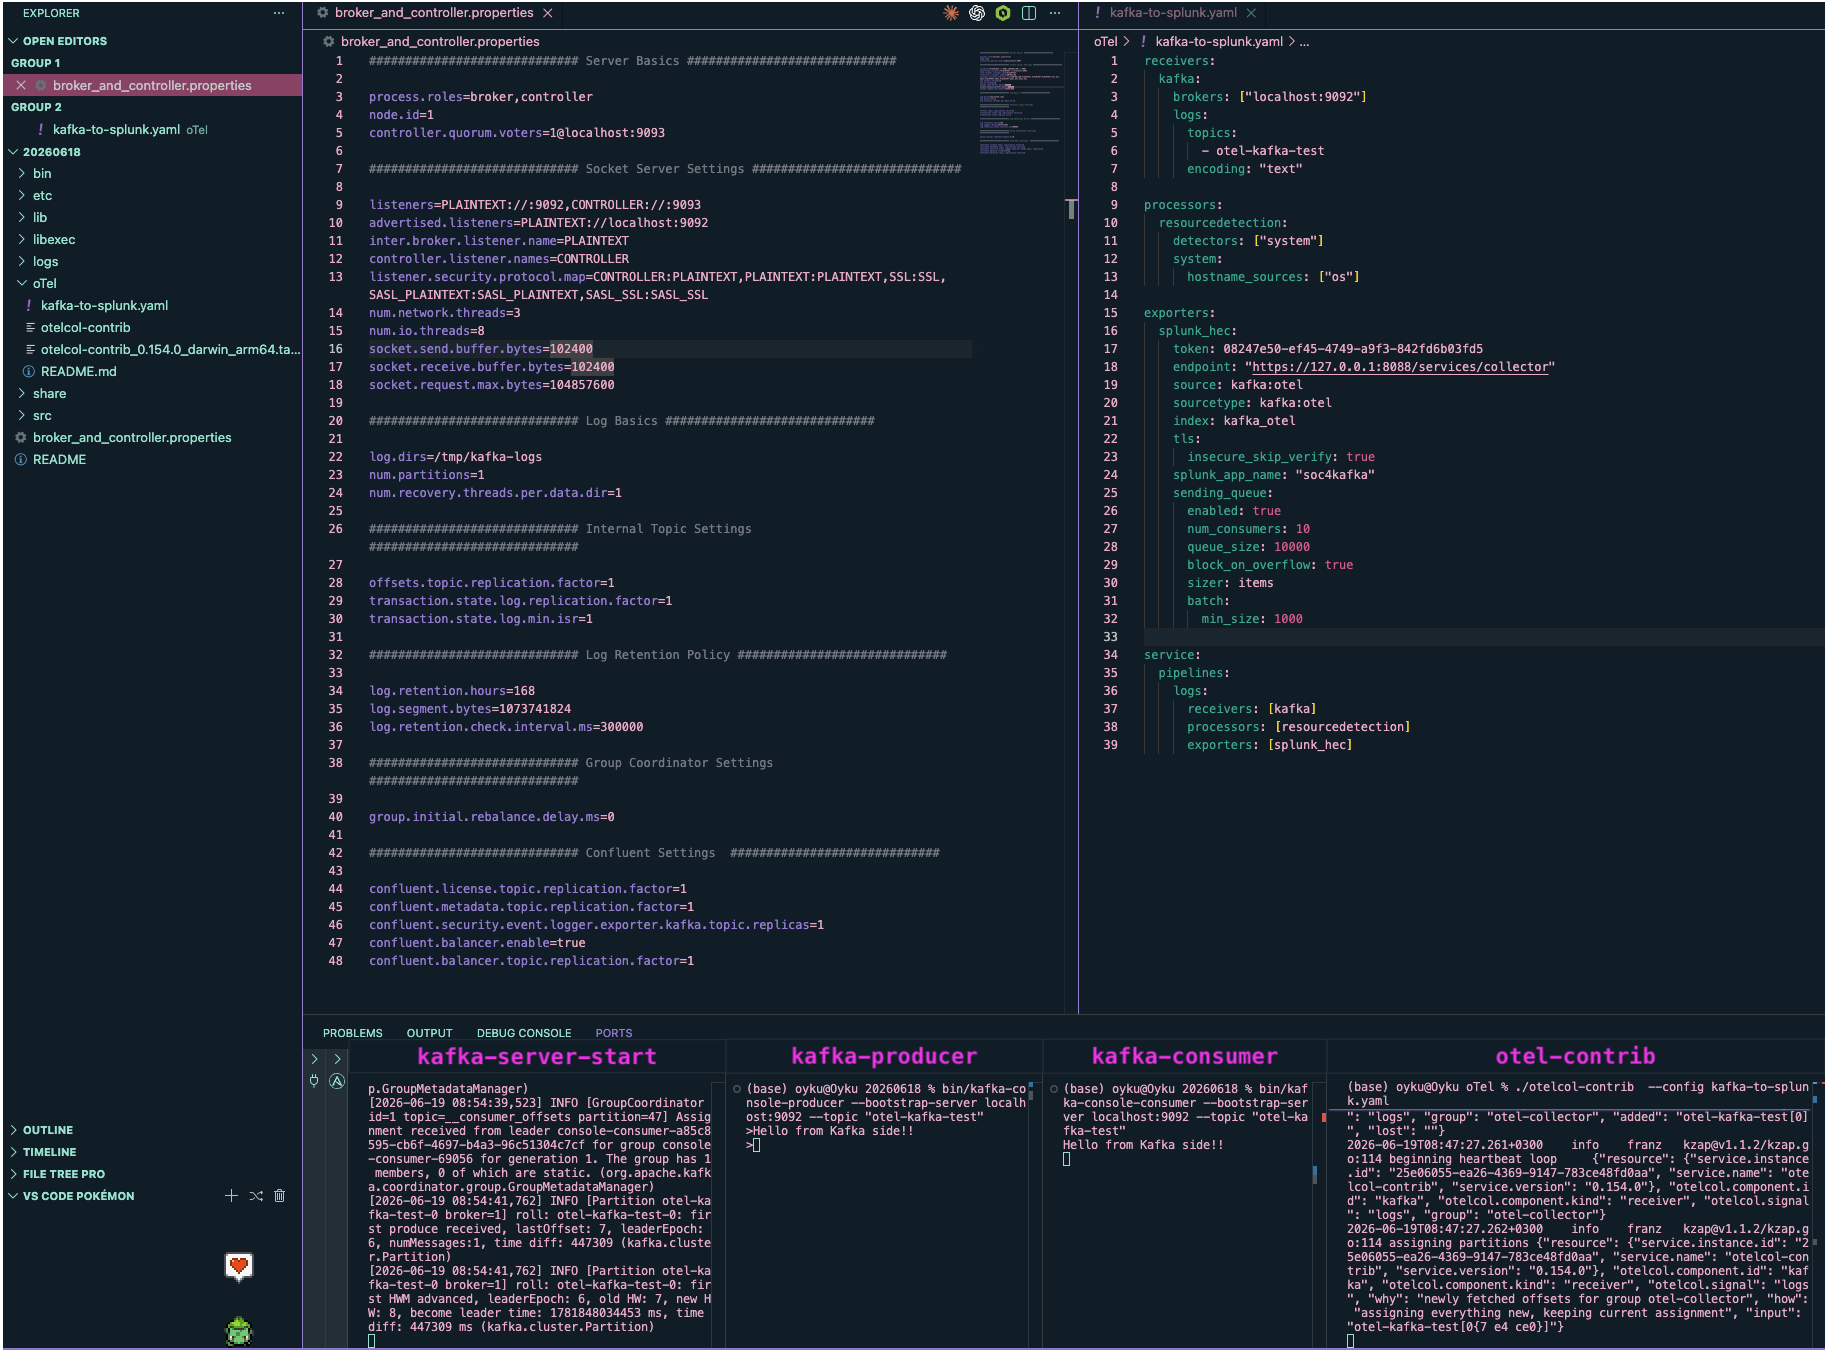
The below image shows the complete execution flow with the broker, producer, consumer, and otelcol-contrib all working together:
 |
|---|
| Figure 1: All components running: kafka-server-start, kafka-producer, kafka-consumer, and otelcol-contrib terminals |
Trivia: The Bulbasaur has always been my starter Pokémon, so of course, it must take care of the editor in the pipeline! 🍃
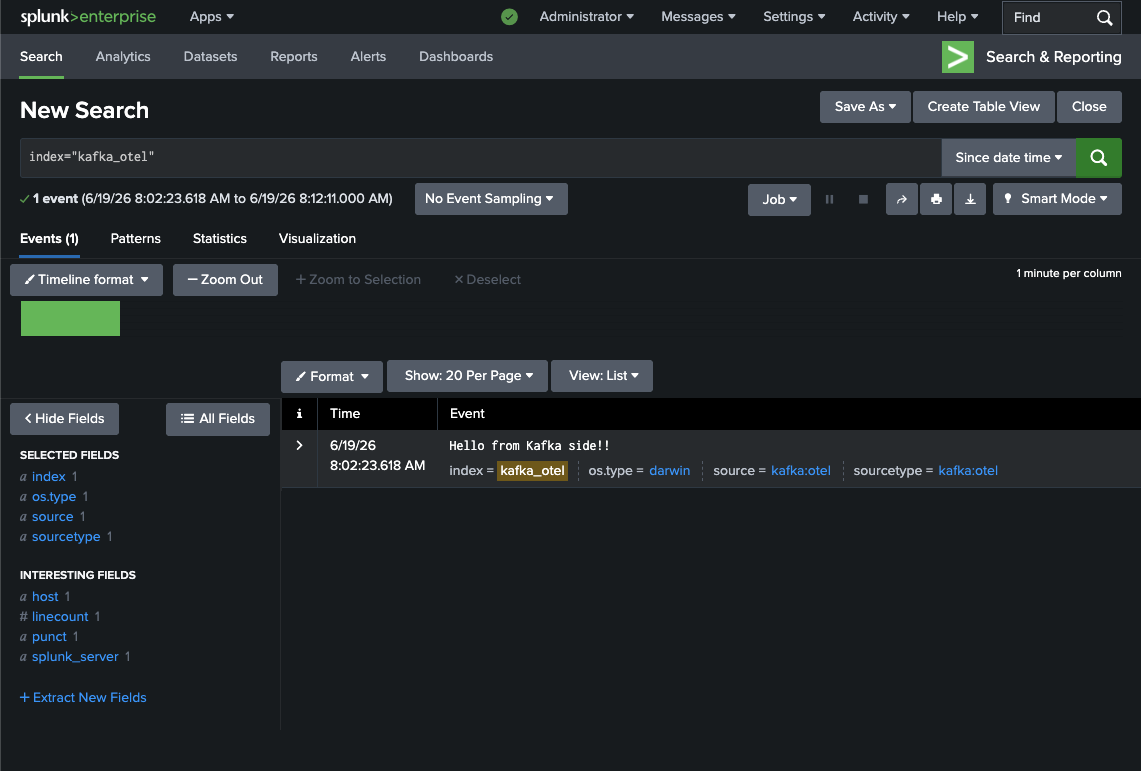
So, head to Splunk and run:
index="kafka_otel"
You should be able to see your event pop up with source = kafka:otel, sourcetype = kafka:otel, and os.type = darwin (or any other operating system you might be running).
 |
|---|
| Figure 2: Splunk Search showing “Hello from Kafka side!!” event with os.type=darwin, source=kafka:otel, sourcetype=kafka:otel |
Wrap-up
This is how it works end-to-end: Kafka → otelcol-contrib → Splunk without any Java collectors. Very simple to deploy, very easy configuration and most importantly, this approach is recommended by Splunk to move on to OTel collectors.
In a production environment, one should think about:
- TLS connection between collector and Kafka (SASL/SSL)
- otelcol-contrib as a systemd service (Linux) or launchd plist (macOS)
This was a development setup and the YAML is scaleable. Start with this.
Also, any questions or comments? Contact me on LinkedIn!
Until next time! 🌱 ૮₍ ˶ᵔ ᵕ ᵔ˶ ₎ა
Part of the Kafka × Splunk series:
- Part 1: Windows Event Logs → Kafka via S2S Connector
- Part 2: Streaming Logs from Kafka to Splunk Using the Splunk Sink Connector
- Part 3: Routing Linux Logs with Splunk Edge + OTel
- Part 4: This post
References
- [1] Can, Ö. (2024). Send Windows Event Logs to Kafka the Easy Way with Splunk UF & S2S Kafka Connector. Seynur. https://blog.seynur.com/splunk/2025/09/18/streaming-windows-events-to-kafka-with-s2s-connector.html
- [2] Seynur. (2025). Streaming Logs from Kafka to Splunk Using the Splunk Sink Connector. Seynur. https://blog.seynur.com/splunk/2025/09/24/streaming-logs-from-kafka-to-splunk-using-the-splunk-sink-connector.html
- [3] Can, Ö. (2025). Routing and Masking Linux Logs with Splunk Edge and OpenTelemetry. Seynur. https://blog.seynur.com/splunk/2026/05/15/otel-splunk-edge-poc.html Splunk. (2025).
- [4] Splunk. (2026). splunk-opentelemetry-collector-for-kafka [Computer software]. GitHub. https://github.com/splunk/splunk-opentelemetry-collector-for-kafka
- [5] OpenTelemetry. (2025). opentelemetry-collector-releases [Computer software]. GitHub. https://github.com/open-telemetry/opentelemetry-collector-releases
- [6] Confluent. (2025). Confluent Platform. https://www.confluent.io/installation/